Tracing V8
V8 provides support for tracing. It works automatically when V8 is embedded in Chrome through the Chrome tracing system. But you can also enable it in any standalone V8 or within an embedder that uses the Default Platform. More details about the trace-viewer can be found here.
Tracing in d8 #
To start tracing, use the --enable-tracing option. V8 generates a v8_trace.json that you can open in Chrome. To open it in Chrome, go to chrome://tracing, click on “Load”, and then load the v8-trace.json file.
Each trace event is a associated with a set of categories, you can enable/disable the recording of trace events based on their categories. With the above flag only, we only enable the default categories (a set of categories that has a low overhead). To enable more categories and have a more fine control of the different parameters, you need to pass a config file.
Here’s an example of a config file traceconfig.json:
{
  "record_mode": "record-continuously",
  "included_categories": ["v8", "disabled-by-default-v8.runtime_stats"]
}
An example of calling d8 with tracing and a traceconfig file:
d8 --enable-tracing --trace-config=traceconfig.json
The trace config format is compatible with the one of Chrome Tracing, however, we don’t support regular expression in included categories list, and V8 doesn’t need excluded categories list, thus the trace config file for V8 can be reused in Chrome tracing, but you can’t reuse Chrome trace config file in V8 tracing if the trace config file contains regular expression, besides, V8 ignores the excluded categories list.
Enabling Runtime Call Statistics in tracing #
To get Runtime Call Statistics (RCS), please record the trace with the following two categories enabled: v8 and disabled-by-default-v8.runtime_stats. Each top-level V8 trace event contains the runtime statistics for the period of that event. By selecting any of those events in trace-viewer, the runtime stats table are displayed in the lower panel. Selecting multiple events create a merged view.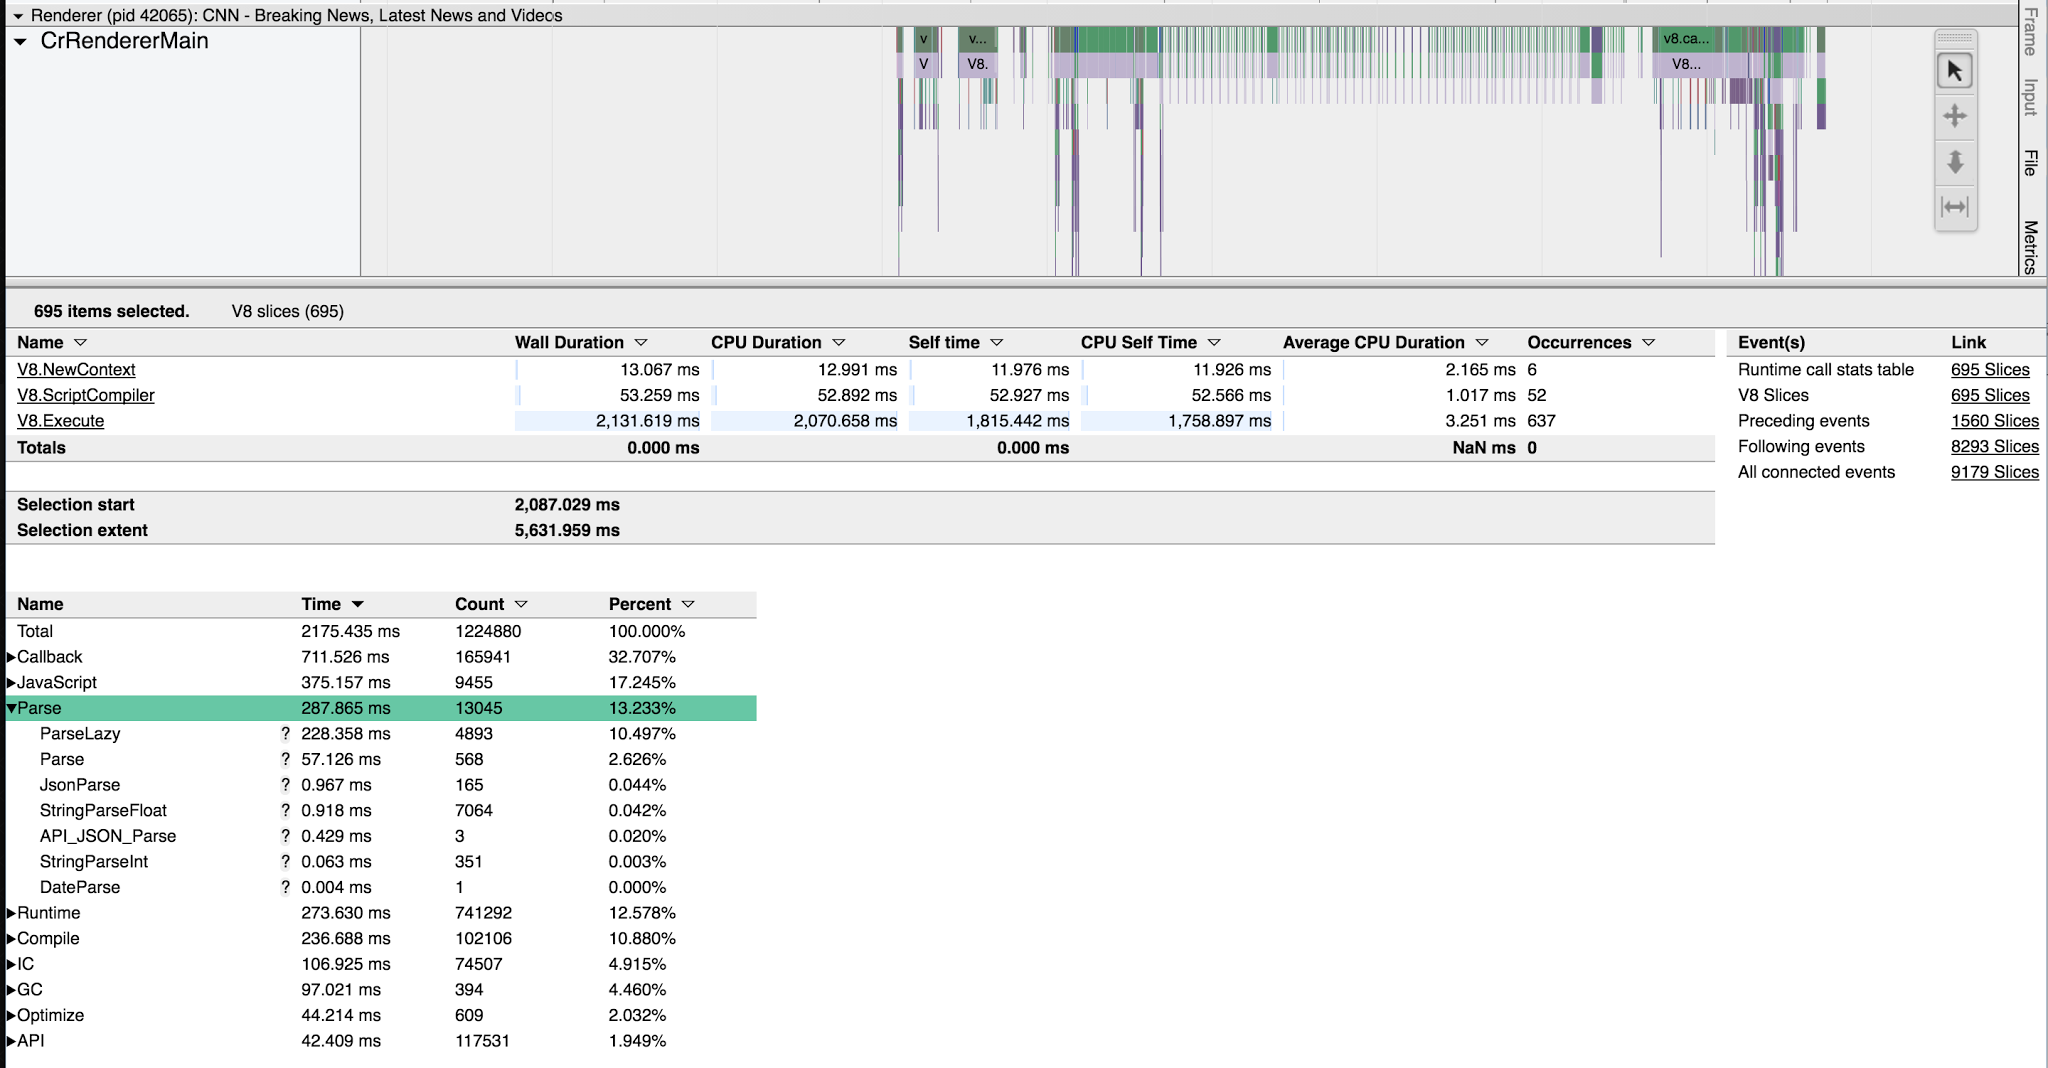
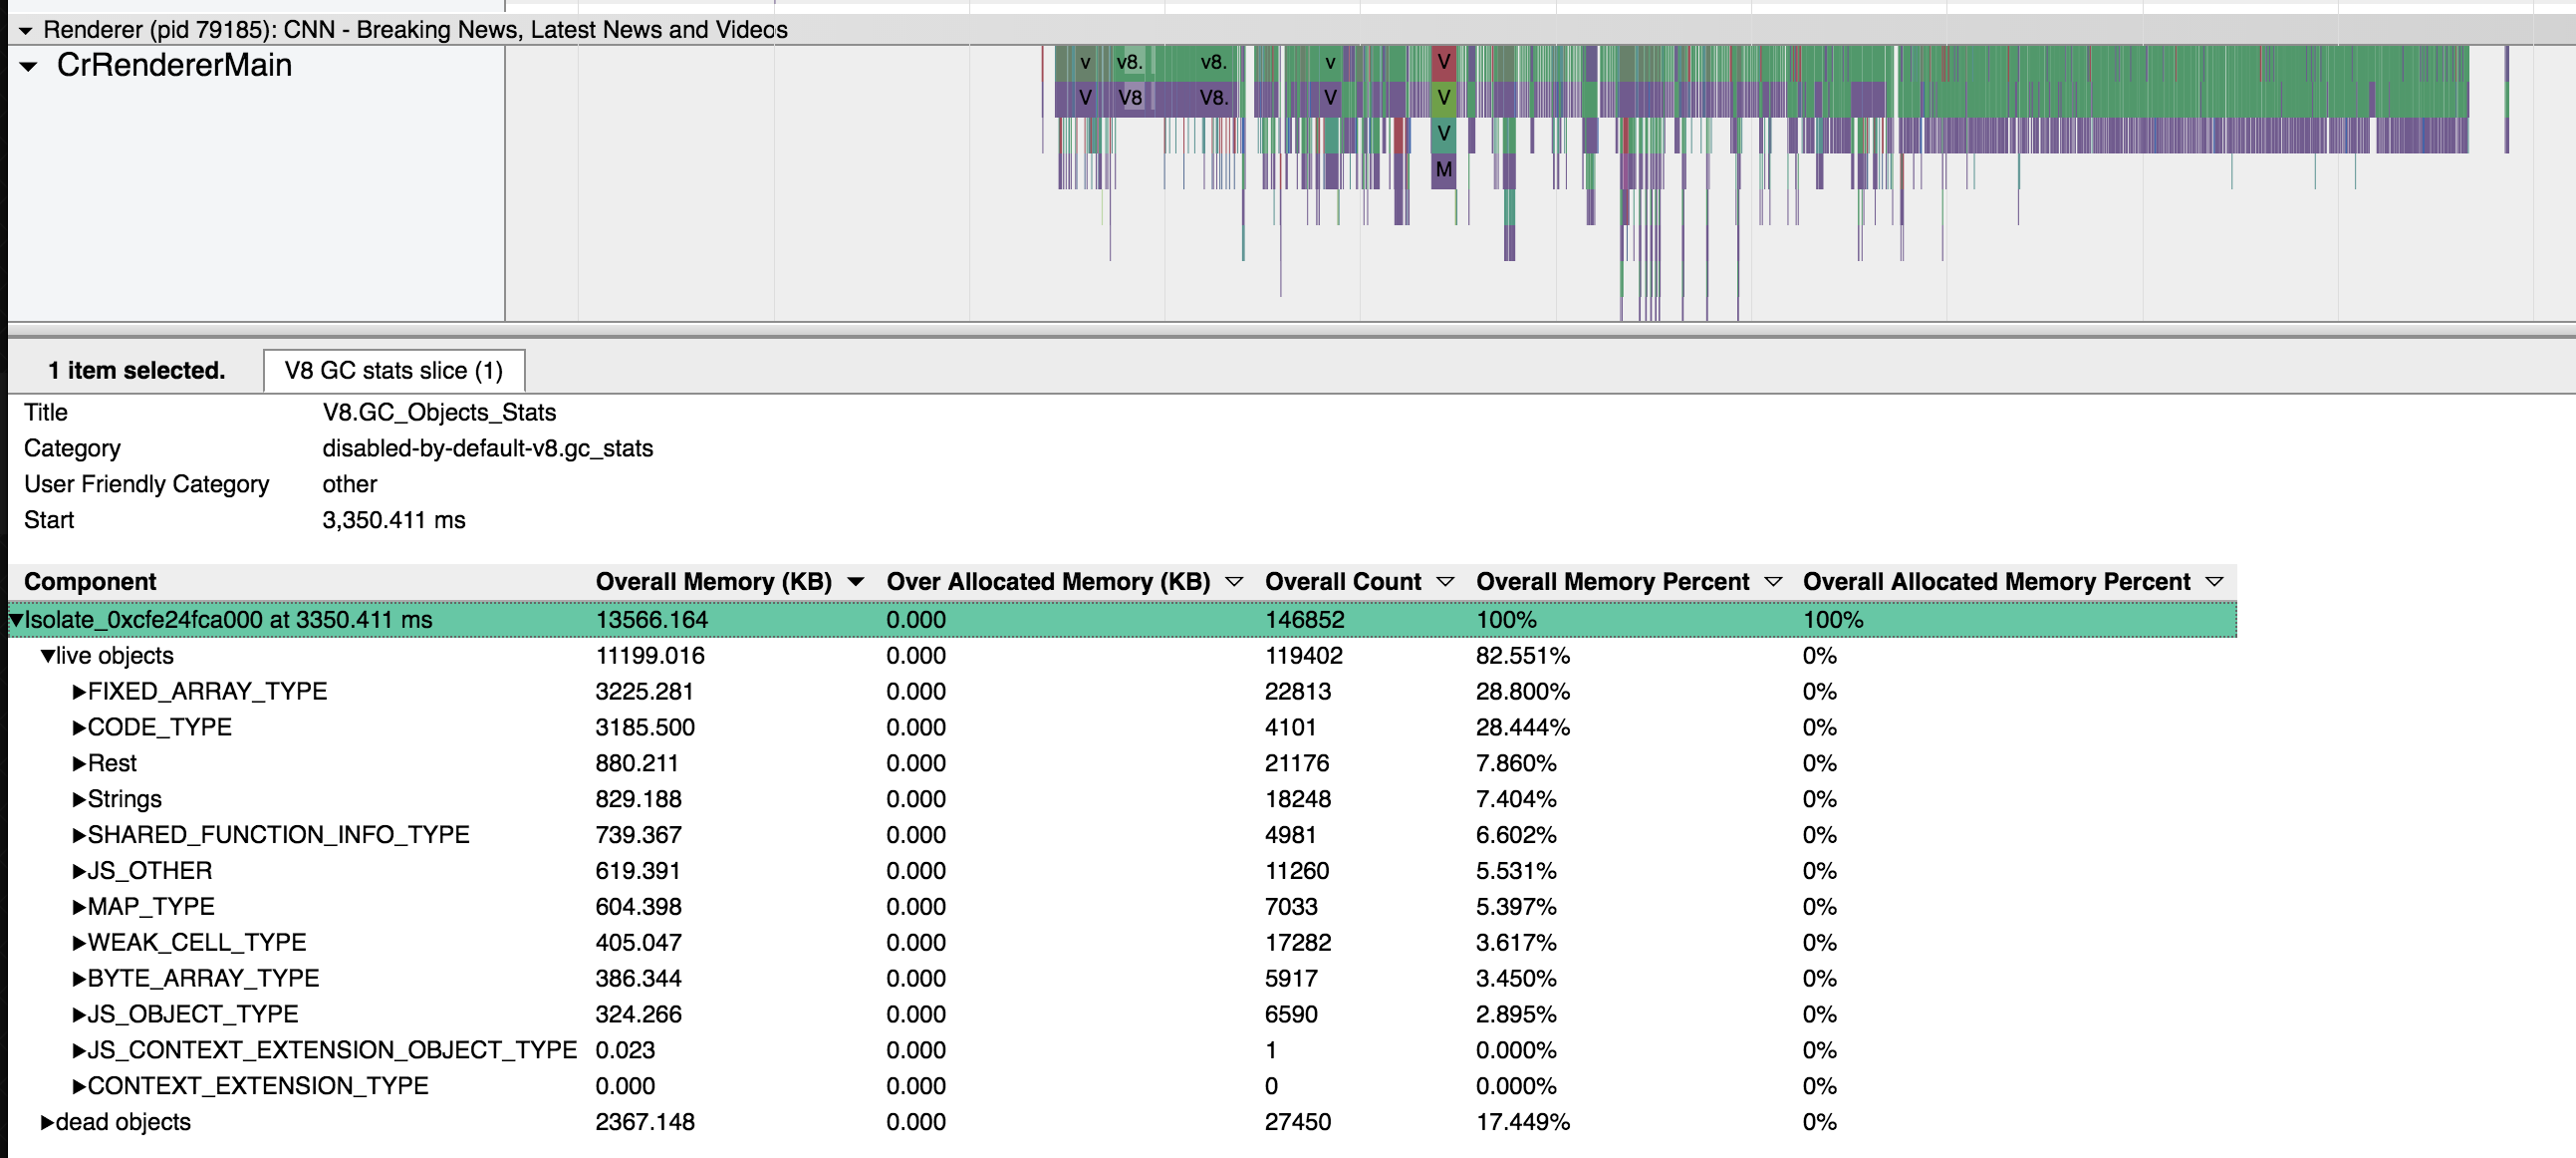
Enabling GC Object Statistics in tracing #
To get the GC Object Statistics in tracing, you need to collect a trace with disabled-by-default-v8.gc_stats category enabled also you need to use the following --js-flags:
--track_gc_object_stats --noincremental-marking
Once you load the trace in trace-viewer, search for slices named: V8.GC_Object_Stats. The statistics appear in the lower panel. Selecting multiple slices creates a merged view.