Runtime Call Stats
The DevTools Performance panel gives insights into your web app’s runtime performance by visualizing various Chrome-internal metrics. However, certain low-level V8 metrics aren’t currently exposed in DevTools. This article guides you through the most robust way of gathering detailed V8-internal metrics, known as Runtime Call Stats or RCS, through chrome://tracing.
Tracing records the behavior of the entire browser, including other tabs, windows, and extensions, so it works best when done in a clean user profile, with extensions disabled, and with no other browser tabs open:
google-chrome --user-data-dir="$(mktemp -d)" --disable-extensions
Type the URL of the page you want to measure in the first tab, but do not load the page yet.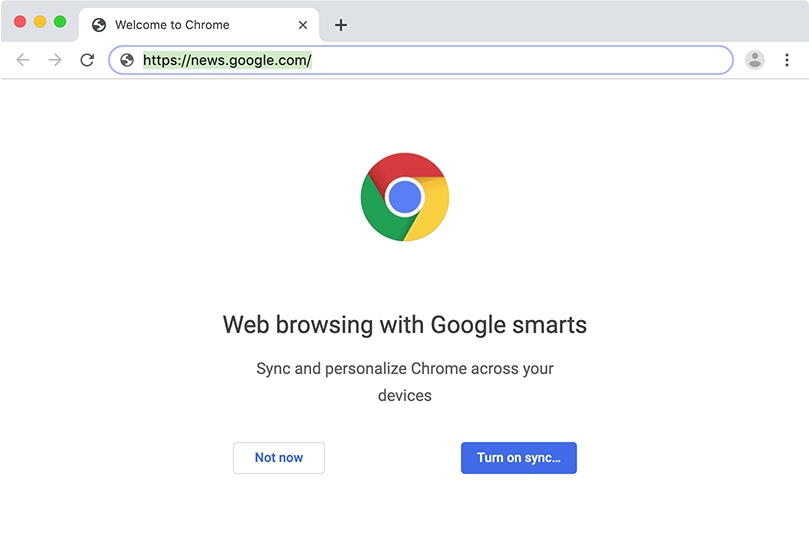
Add a second tab and open chrome://tracing. Tip: you can just enter chrome:tracing, without the slashes.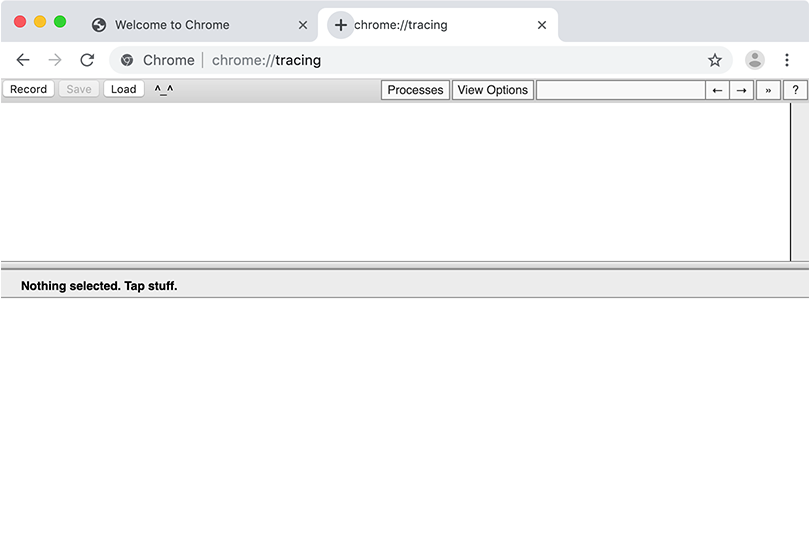
Click on the “Record” button to prepare recording a trace. First choose “Web developer” and then select “Edit categories”.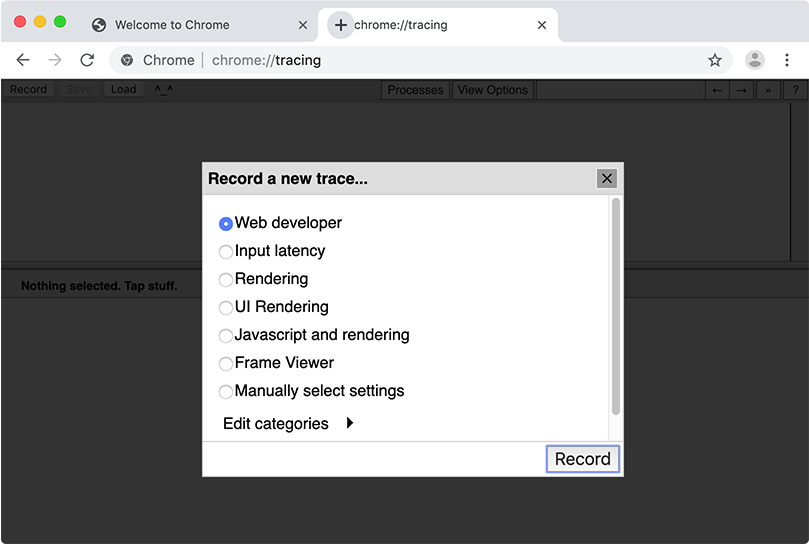
Select v8.runtime_stats from the list. Depending on how detailed your investigation is, you may select other categories as well.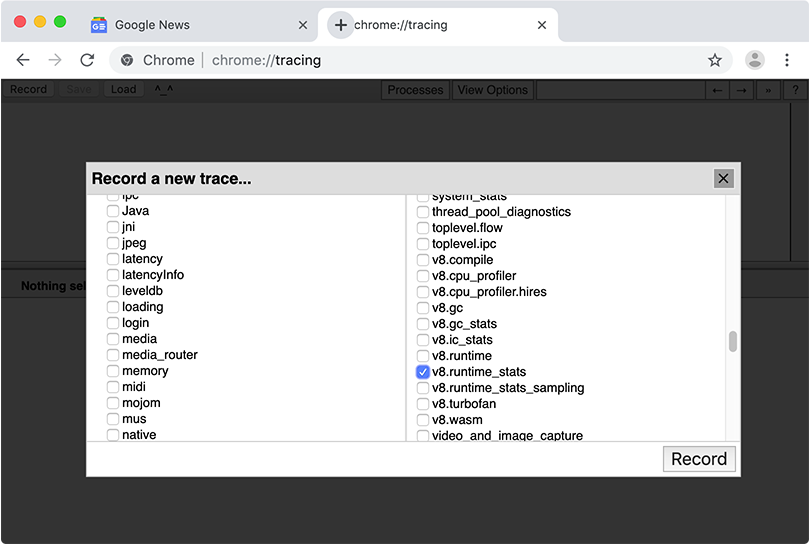
Press “Record” and switch back to the first tab and load the page. The fastest way is to use Ctrl/⌘+1 to directly jump to the first tab and then press Enter to accept the entered URL.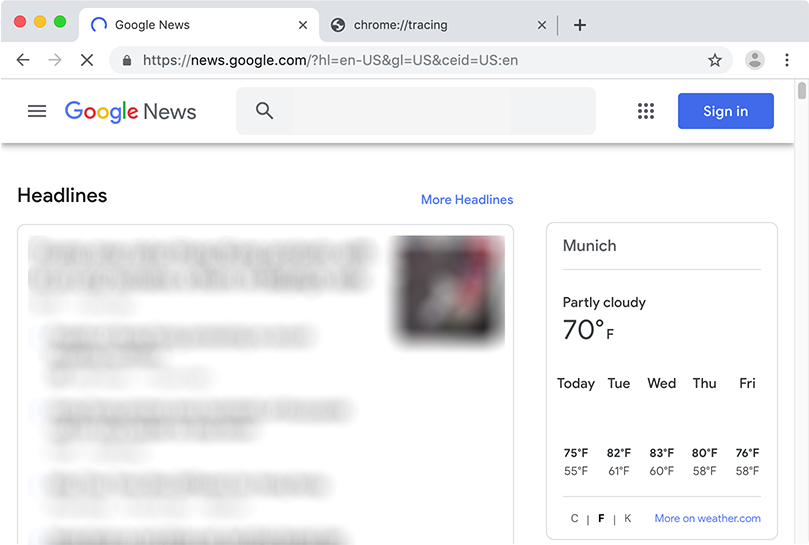
Wait until your page has completed loading or the buffer is full, then “Stop” the recording.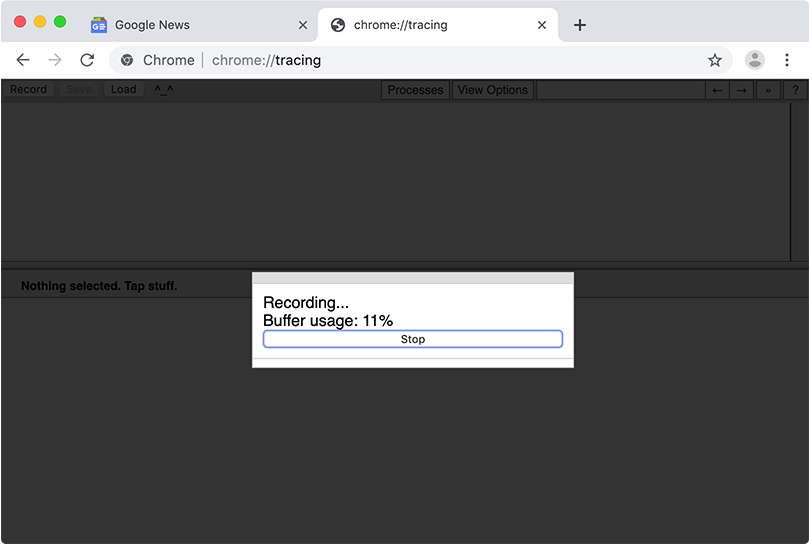
Look for a “Renderer” section that contains the web page title from the recorded tab. The easiest way to do this is by clicking “Processes”, then clicking “None” to uncheck all entries, and then selecting only the renderer you’re interested in.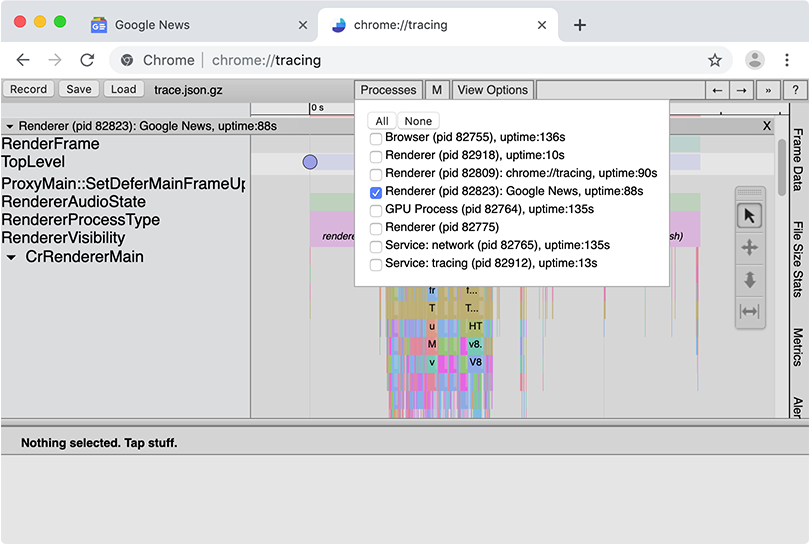
Select the trace events/slices by pressing Shift and dragging. Make sure you cover all the sections, including CrRendererMain and any ThreadPoolForegroundWorkers. A table with all the selected slices appears at the bottom.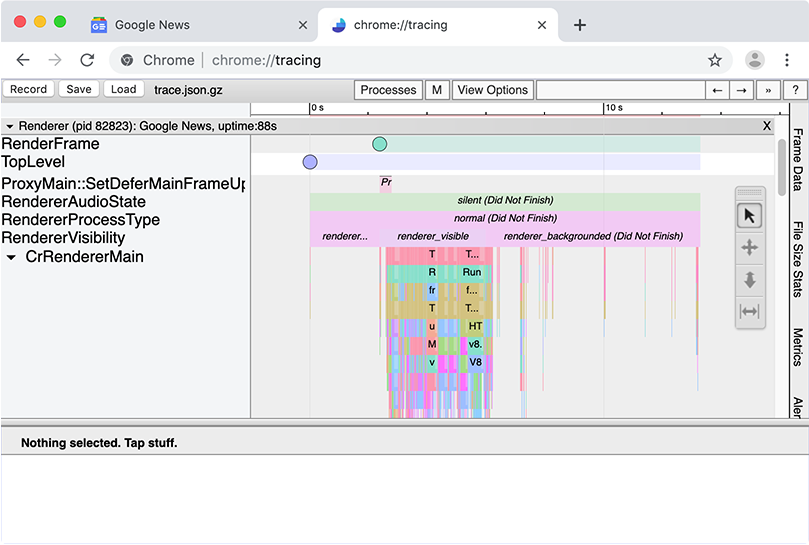
Scroll to the top right of the table and click on the link next to “Runtime call stats table”.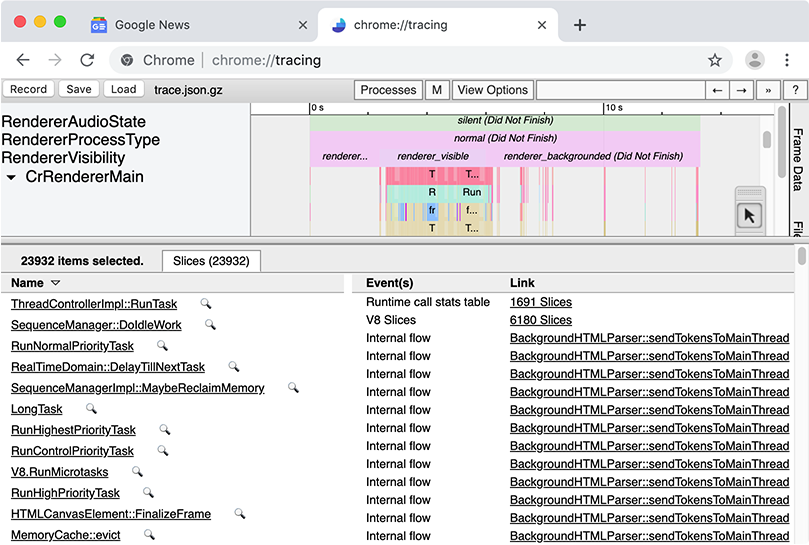
In the view that appears, scroll to the bottom to see a detailed table of where V8 spends its time.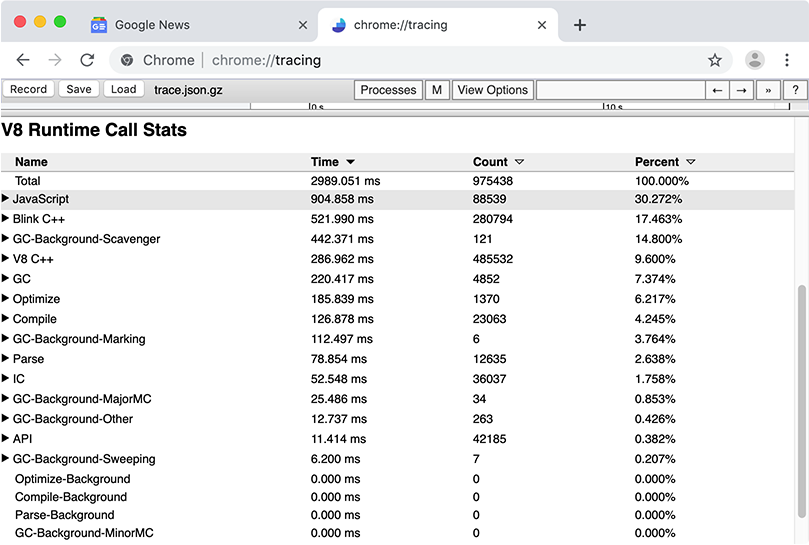
By flipping open a category you can further drill down into the data.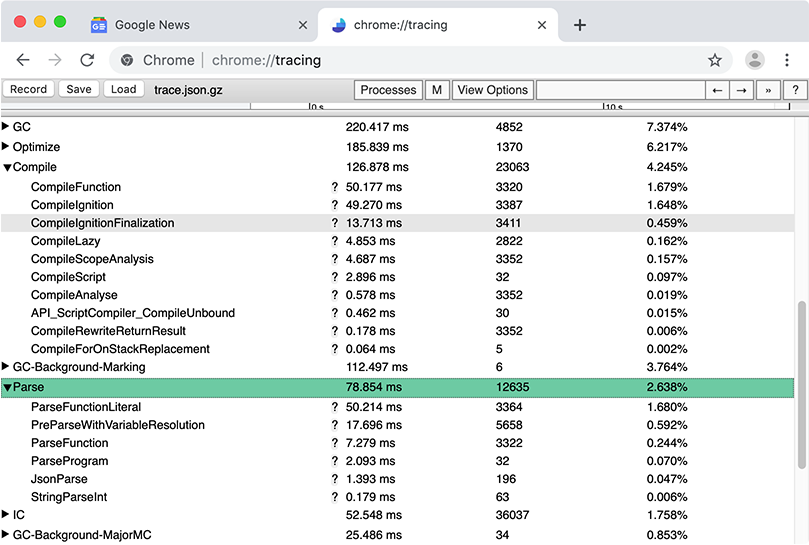
Command-line interface #
Run d8 with --runtime-call-stats to get RCS metrics from the command-line:
d8 --runtime-call-stats foo.js