Using V8’s sample-based profiler
V8 has built-in sample-based profiling. Profiling is turned off by default, but can be enabled via the --prof command-line option. The sampler records stacks of both JavaScript and C/C++ code.
Build #
Build the d8 shell following the instructions at Building with GN.
Command line #
To start profiling, use the --prof option. When profiling, V8 generates a v8.log file which contains profiling data.
Windows:
build\Release\d8 --prof script.js
Other platforms (replace ia32 with x64 if you want to profile the x64 build):
out/ia32.release/d8 --prof script.js
Process the generated output #
Log file processing is done using JS scripts running by the d8 shell. For this to work, a d8 binary (or symlink, or d8.exe on Windows) must be in the root of your V8 checkout, or in the path specified by the environment variable D8_PATH. Note: this binary is just used to process the log, but not for the actual profiling, so it doesn’t matter which version etc. it is.
Make sure d8 used for analysis was not built with is_component_build!
Windows:
tools\windows-tick-processor.bat v8.log
Linux:
tools/linux-tick-processor v8.log
macOS:
tools/mac-tick-processor v8.log
Web UI for --prof #
Preprocess the log with --preprocess (to resolve C++ symbols, etc).
$V8_PATH/tools/linux-tick-processor --preprocess > v8.json
Open tools/profview/index.html in your browser and select the v8.json file there.
Example output #
Statistical profiling result from benchmarks\v8.log, (4192 ticks, 0 unaccounted, 0 excluded).

 [Shared libraries]:
   ticks  total  nonlib   name
      9    0.2%    0.0%  C:\WINDOWS\system32\ntdll.dll
      2    0.0%    0.0%  C:\WINDOWS\system32\kernel32.dll

 [JavaScript]:
   ticks  total  nonlib   name
    741   17.7%   17.7%  LazyCompile: am3 crypto.js:108
    113    2.7%    2.7%  LazyCompile: Scheduler.schedule richards.js:188
    103    2.5%    2.5%  LazyCompile: rewrite_nboyer earley-boyer.js:3604
    103    2.5%    2.5%  LazyCompile: TaskControlBlock.run richards.js:324
     96    2.3%    2.3%  Builtin: JSConstructCall
    ...

 [C++]:
   ticks  total  nonlib   name
     94    2.2%    2.2%  v8::internal::ScavengeVisitor::VisitPointers
     33    0.8%    0.8%  v8::internal::SweepSpace
     32    0.8%    0.8%  v8::internal::Heap::MigrateObject
     30    0.7%    0.7%  v8::internal::Heap::AllocateArgumentsObject
    ...


 [GC]:
   ticks  total  nonlib   name
    458   10.9%

 [Bottom up (heavy) profile]:
  Note: percentage shows a share of a particular caller in the total
  amount of its parent calls.
  Callers occupying less than 2.0% are not shown.

   ticks parent  name
    741   17.7%  LazyCompile: am3 crypto.js:108
    449   60.6%    LazyCompile: montReduce crypto.js:583
    393   87.5%      LazyCompile: montSqrTo crypto.js:603
    212   53.9%        LazyCompile: bnpExp crypto.js:621
    212  100.0%          LazyCompile: bnModPowInt crypto.js:634
    212  100.0%            LazyCompile: RSADoPublic crypto.js:1521
    181   46.1%        LazyCompile: bnModPow crypto.js:1098
    181  100.0%          LazyCompile: RSADoPrivate crypto.js:1628
    ...
Profiling web applications #
Today’s highly optimized virtual machines can run web apps at blazing speed. But one shouldn’t rely only on them to achieve great performance: a carefully optimized algorithm or a less expensive function can often reach many-fold speed improvements on all browsers. Chrome DevTools’ CPU Profiler helps you analyze your code’s bottlenecks. But sometimes, you need to go deeper and more granular: this is where V8’s internal profiler comes in handy.
Let’s use that profiler to examine the Mandelbrot explorer demo that Microsoft released together with IE10. After the demo release, V8 has fixed a bug that slowed down the computation unnecessarily (hence the poor performance of Chrome in the demo’s blog post) and further optimized the engine, implementing a faster exp() approximation than what the standard system libraries provide. Following these changes, the demo ran 8× faster than previously measured in Chrome.
But what if you want the code to run faster on all browsers? You should first understand what keeps your CPU busy. Run Chrome (Windows and Linux Canary) with the following command line switches, which causes it to output profiler tick information (in the v8.log file) for the URL you specify, which in our case was a local version of the Mandelbrot demo without web workers:
./chrome --js-flags='--prof' --no-sandbox 'http://localhost:8080/'
When preparing the test case, make sure it begins its work immediately upon load, and close Chrome when the computation is done (hit Alt+F4), so that you only have the ticks you care about in the log file. Also note that web workers aren’t yet profiled correctly with this technique.
Then, process the v8.log file with the tick-processor script that ships with V8 (or the new practical web version):
v8/tools/linux-tick-processor v8.log
Here’s an interesting snippet of the processed output that should catch your attention:
Statistical profiling result from null, (14306 ticks, 0 unaccounted, 0 excluded).
 [Shared libraries]:
   ticks  total  nonlib   name
   6326   44.2%    0.0%  /lib/x86_64-linux-gnu/libm-2.15.so
   3258   22.8%    0.0%  /.../chrome/src/out/Release/lib/libv8.so
   1411    9.9%    0.0%  /lib/x86_64-linux-gnu/libpthread-2.15.so
     27    0.2%    0.0%  /.../chrome/src/out/Release/lib/libwebkit.so
The top section shows that V8 is spending more time inside an OS-specific system library than in its own code. Let’s look at what’s responsible for it by examining the “bottom up” output section, where you can read indented lines as “was called by” (and lines starting with a * mean that the function has been optimized by TurboFan):
[Bottom up (heavy) profile]:
  Note: percentage shows a share of a particular caller in the total
  amount of its parent calls.
  Callers occupying less than 2.0% are not shown.

   ticks parent  name
   6326   44.2%  /lib/x86_64-linux-gnu/libm-2.15.so
   6325  100.0%    LazyCompile: *exp native math.js:91
   6314   99.8%      LazyCompile: *calculateMandelbrot http://localhost:8080/Demo.js:215
More than 44% of the total time is spent executing the exp() function inside a system library! Adding some overhead for calling system libraries, that means about two thirds of the overall time are spent evaluating Math.exp().
If you look at the JavaScript code, you’ll see that exp() is used solely to produce a smooth grayscale palette. There are countless ways to produce a smooth grayscale palette, but let’s suppose you really really like exponential gradients. Here is where algorithmic optimization comes into play.
You’ll notice that exp() is called with an argument in the range -4 < x < 0, so we can safely replace it with its Taylor approximation for that range, which delivers the same smooth gradient with only a multiplication and a couple of divisions:
exp(x) ≈ 1 / ( 1 - x + x * x / 2) for -4 < x < 0
Tweaking the algorithm this way boosts the performance by an extra 30% compared to latest Canary and 5× to the system library based Math.exp() on Chrome Canary.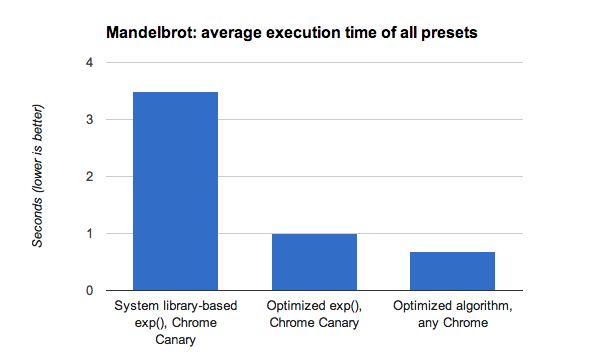
This example shows how V8’s internal profiler can help you go deeper into understanding your code bottlenecks, and that a smarter algorithm can push performance even further.
To find out more about how benchmark that represent today’s complex and demanding web applications, read How V8 measures real-world performance.