Debugging memory leaks in Chrome 66 just became much easier. Chrome’s DevTools can now trace and snapshot C++ DOM objects and display all reachable DOM objects from JavaScript with their references. This feature is one of the benefits of the new C++ tracing mechanism of the V8 garbage collector.
Background #
A memory leak in a garbage collection system occurs when an unused object is not freed due to unintentional references from other objects. Memory leaks in web pages often involve interaction between JavaScript objects and DOM elements.
The following toy example shows a memory leak that happens when a programmer forgets to unregister an event listener. None of the objects referenced by the event listener can be garbage collected. In particular, the iframe window leaks together with the event listener.
const iframe = document.createElement('iframe');
iframe.src = 'iframe.html';
document.body.appendChild(iframe);
iframe.addEventListener('load', function() {
const localVariable = iframe.contentWindow;
function leakingListener() {
if (localVariable) {}
}
document.body.addEventListener('my-debug-event', leakingListener);
document.body.removeChild(iframe);
});
The leaking iframe window also keeps all its JavaScript objects alive.
class Leak {};
window.globalVariable = new Leak();
It is important to understand the notion of retaining paths to find the root cause of a memory leak. A retaining path is a chain of objects that prevents garbage collection of the leaking object. The chain starts at a root object such as the global object of the main window. The chain ends at the leaking object. Each intermediate object in the chain has a direct reference to the next object in the chain. For example, the retaining path of the Leak object in the iframe looks as follows: Figure 1: Retaining path of an object leaked via
 iframe and event listener
Note that the retaining path crosses the JavaScript / DOM boundary (highlighted in green/red, respectively) two times. The JavaScript objects live in the V8 heap, while DOM objects are C++ objects in Chrome.
We can inspect the retaining path of any object by taking a heap snapshot in DevTools. The heap snapshot precisely captures all objects on the V8 heap. Up until recently it had only approximate information about the C++ DOM objects. For instance, Chrome 65 shows an incomplete retaining path for the Leak object from the toy example: Figure 2: Retaining path in Chrome 65
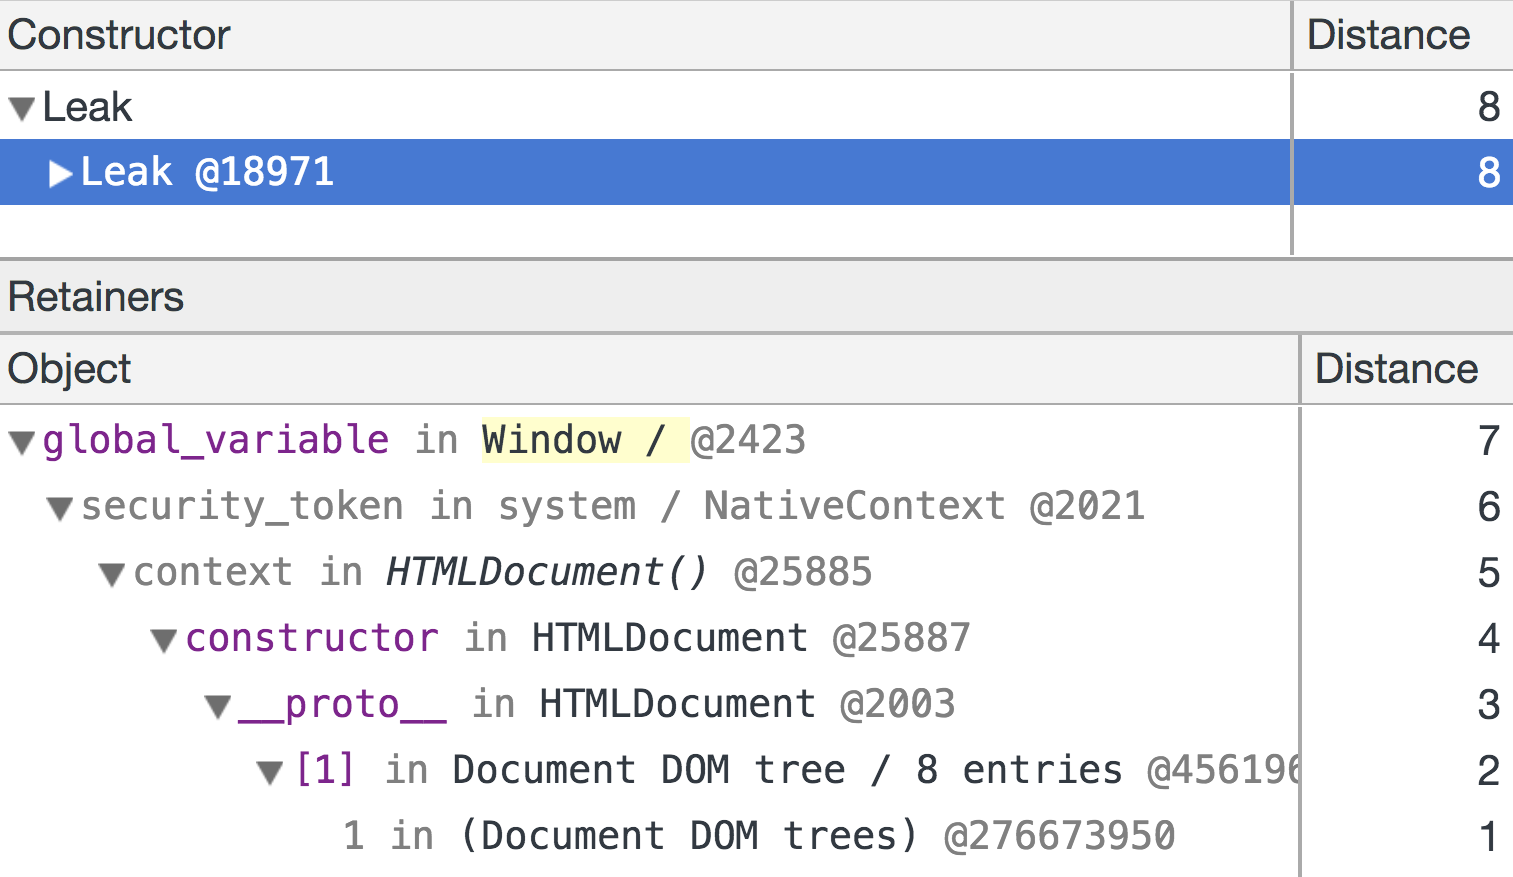
Only the first row is precise: the Leak object is indeed stored in the global_variable of the iframe’s window object. Subsequent rows approximate the real retaining path and make debugging of the memory leak hard.
As of Chrome 66, DevTools traces through C++ DOM objects and precisely captures the objects and references between them. This is based on the powerful C++ object tracing mechanism that was introduced for cross-component garbage collection earlier. As a result, the retaining path in DevTools is actually correct now:Figure 3: Retaining path in Chrome 66
Under the hood: cross-component tracing #
DOM objects are managed by Blink — the rendering engine of Chrome, which is responsible for translating the DOM into actual text and images on the screen. Blink and its representation of the DOM are written in C++ which means that the DOM cannot be directly exposed to JavaScript. Instead, objects in the DOM come in two halves: a V8 wrapper object available to JavaScript and a C++ object representing the node in the DOM. These objects have direct references to each other. Determining liveness and ownership of objects across multiple components, such as Blink and V8, is difficult because all involved parties need to agree on which objects are still alive and which ones can be reclaimed.
In Chrome 56 and older versions (i.e. until Mar 2017), Chrome used a mechanism called object grouping to determine liveness. Objects were assigned groups based on containment in documents. A group with all of its containing objects was kept alive as long as a single object was kept alive through some other retaining path. This made sense in the context of DOM nodes that always refer to their containing document, forming so-called DOM trees. However, this abstraction removed all of the actual retaining paths which made it hard to use for debugging as shown in Figure 2. In the case of objects that did not fit this scenario, e.g. JavaScript closures used as event listeners, this approach also became cumbersome and led to various bugs where JavaScript wrapper objects would prematurely get collected, which resulted in them being replaced by empty JS wrappers that would lose all their properties.
Starting from Chrome 57, this approach was replaced by cross-component tracing, which is a mechanism that determines liveness by tracing from JavaScript to the C++ implementation of the DOM and back. We implemented incremental tracing on the C++ side with write barriers to avoid any stop-the-world tracing jank we’ve been talking about in previous blog posts. Cross-component tracing does not only provide better latency but also approximates liveness of objects across component boundaries better and fixes several scenarios that used to cause leaks. On top of that, it allows DevTools to provide a snapshot that actually represents the DOM, as shown in Figure 3.
Try it out! We are happy to hear your feedback.