Indicium: V8 system analyzer #
The past three months have been an awesome learning experience for me as I've joined the V8 team (Google London) as an intern, and have been working on a new tool called Indicium.
This system analyzer is a unified web interface to trace, debug and analyse patterns of how Inline Caches (ICs) and Maps are created and modified in real-world applications.
V8 already has a tracing infrastructure for ICs and Maps which can process and analyse IC events using the IC Explorer and Map events using Map Processor. However, previous tools didn't allow us to analyze maps and ICs holistically and this is now possible with system analyzer. Indicium
Case Study #
Let’s go through an example to demonstrate how we can use the Indicium to analyse Map and IC log events in V8.
class Point {
constructor(x, y) {
if (x < 0 || y < 0) {
this.isNegative = true;
}
this.x = x;
this.y = y;
}
dotProduct(other) {
return this.x * other.x + this.y * other.y;
}
}
let a = new Point(1, 1);
let b = new Point(2, 2);
let dotProduct;
for (let i = 0; i < 10e5; i++) {
dotProduct = a.dotProduct(b);
}
console.time('snippet1');
for (let i = 0; i < 10e6; i++) {
dotProduct = a.dotProduct(b);
}
console.timeEnd('snippet1');
a = new Point(-1, -1);
b = new Point(-2, -2);
console.time('snippet2');
for (let i = 0; i < 10e6; i++) {
dotProduct = a.dotProduct(b);
}
console.timeEnd('snippet2');
Here, we have a Point class that stores two coordinates and an additional boolean based on the values of the co-ordinates. The Point class has a dotProduct method which returns the dot product between the passed object and the receiver.
To make explaining the program easier, let’s break the program into two snippets (ignoring the warmup phase):
snippet 1 #
let a = new Point(1, 1);
let b = new Point(2, 2);
let dotProduct;

console.time('snippet1');
for (let i = 0; i < 10e6; i++) {
  dotProduct = a.dotProduct(b);
}
console.timeEnd('snippet1');
snippet 2 #
a = new Point(-1, -1);
b = new Point(-2, -2);
console.time('snippet2');
for (let i = 0; i < 10e6; i++) {
  dotProduct = a.dotProduct(b);
}
console.timeEnd('snippet2');
Once we run the program we notice a performance regression. Even though we are measuring the performance of two similar snippets; accessing the properties x and y of Point object instances by calling the dotProduct function in a for-loop.
Snippet 1 runs approximately 3 times faster than snippet 2. The only difference being that we use negative values for x and y properties in the Point object in snippet 2.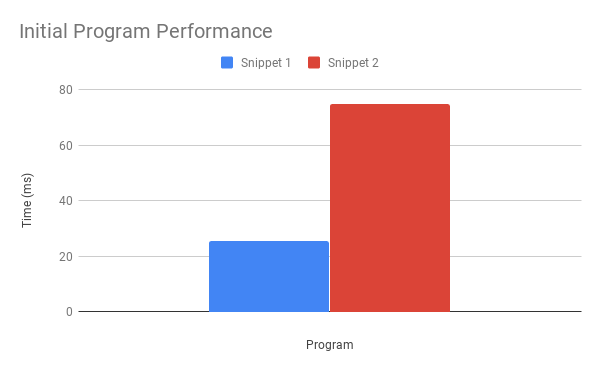 Performance analysis of snippets.
To analyse this performance difference we can use various logging options that come with V8. This is where the system analyzer shines. It can display log events and link them together with map events letting us explore the magic that is hidden within V8.
Before diving more into the case study, let’s get familiar with the panels of the system analyzer tool. The tool has four main panels:
- a Timeline panel to analyse Map/ICs events across time,
- a Map panel to visualise the transition trees of the maps,
- an IC panel to get statistics about the IC events,
- a Source panel to display Map/IC file positions on a script.
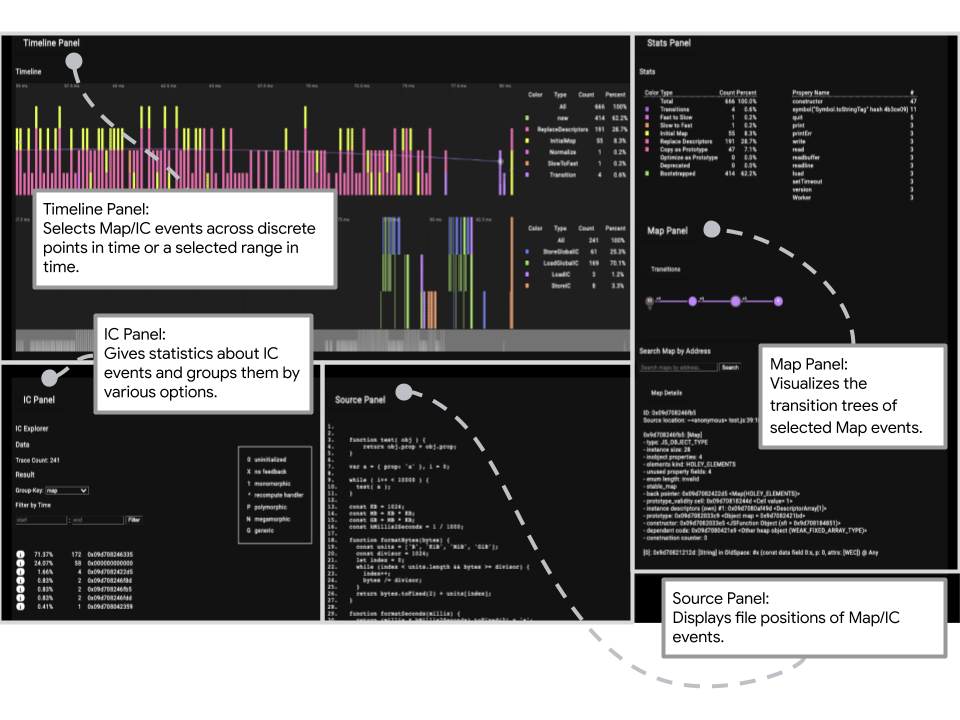 System Analyzer Overview
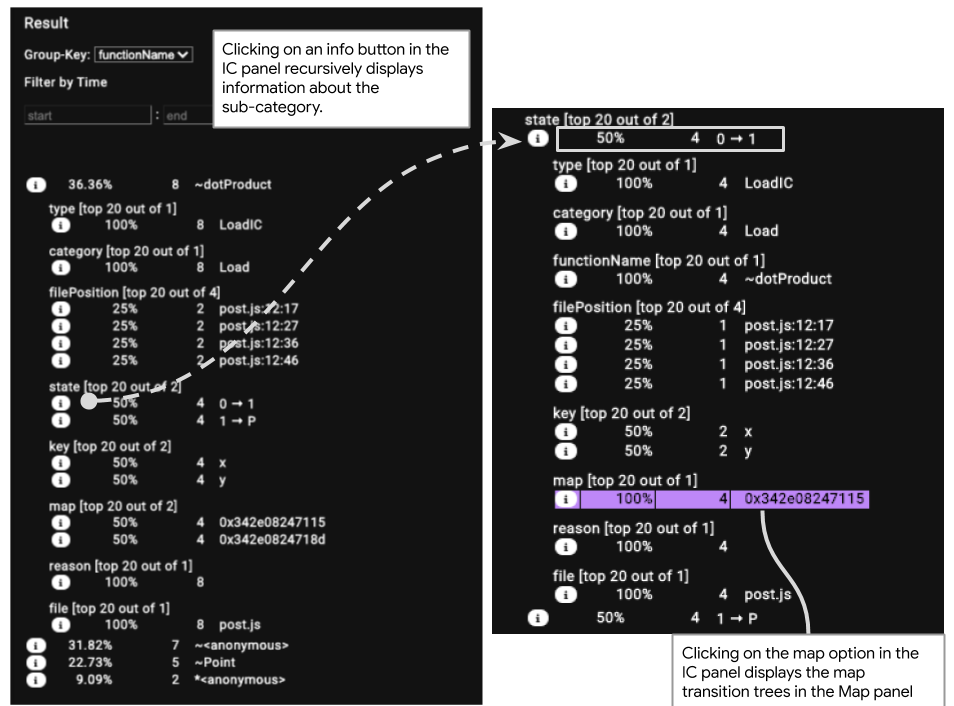 Group IC events by function name to get in depth information about the IC events associated with the
 dotProduct.We are analyzing how the function dotProduct might be causing this performance difference. So we group IC events by functionName to get more in depth information about IC events associated with the dotProduct function.
The first thing we notice is that we have two different IC state transitions recorded by the IC events in this function. One going from uninitialised to monomorphic and the other one going from monomorphic to polymorphic. Polymorphic IC state indicates that now we are tracking more than one Map associated with Point objects and this polymorphic state is worse as we have to perform additional checks.
We want to know why we are creating multiple Map shapes for the same type of objects. To do so, we toggle the info button about IC state to get more information about the Map addresses going from uninitialised to monomorphic.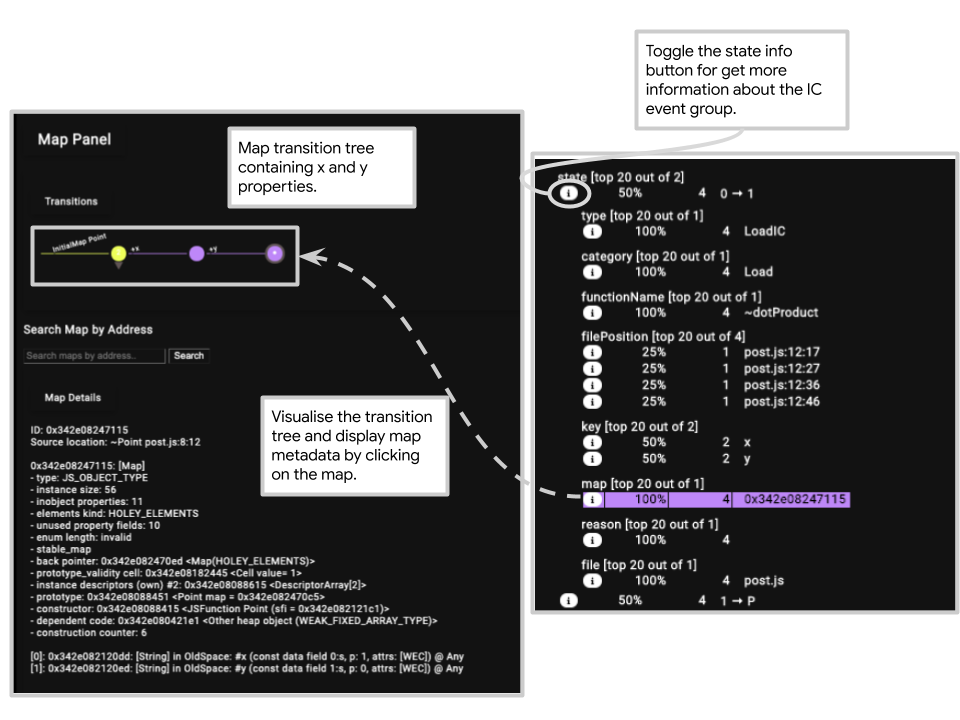 The map transition tree associated with the monomorphic IC state.
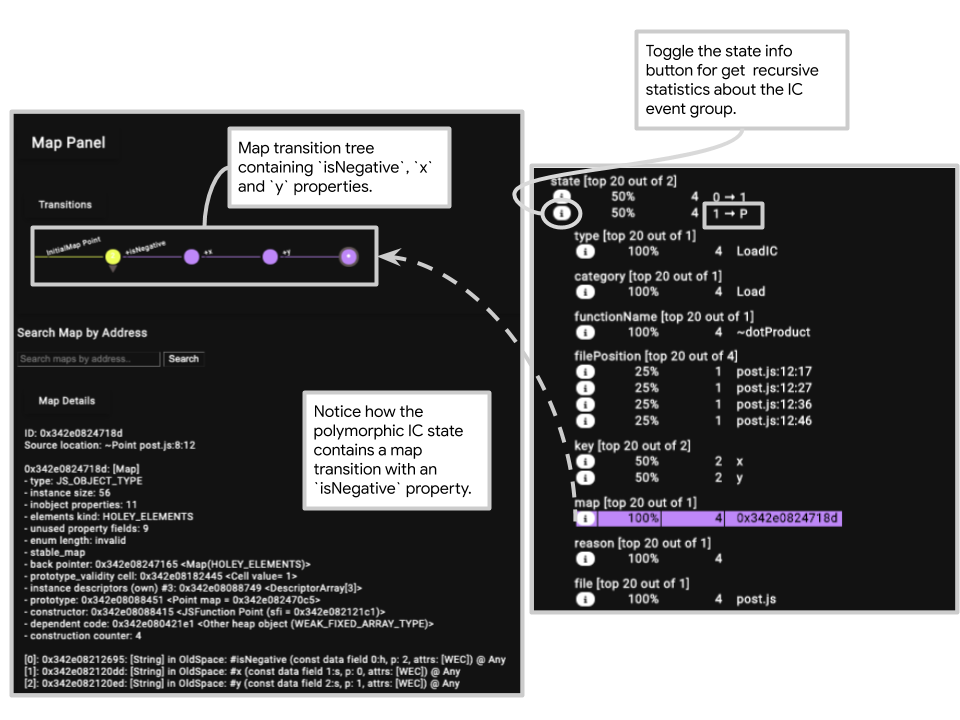 The map transition tree associated with the polymorphic IC state.
For the monomorphic IC state we can visualise the transition tree and see that we are only dynamically adding two properties xand y but when it comes to polymorphic IC state, we have a new Map containing three properties isNegative, x and y.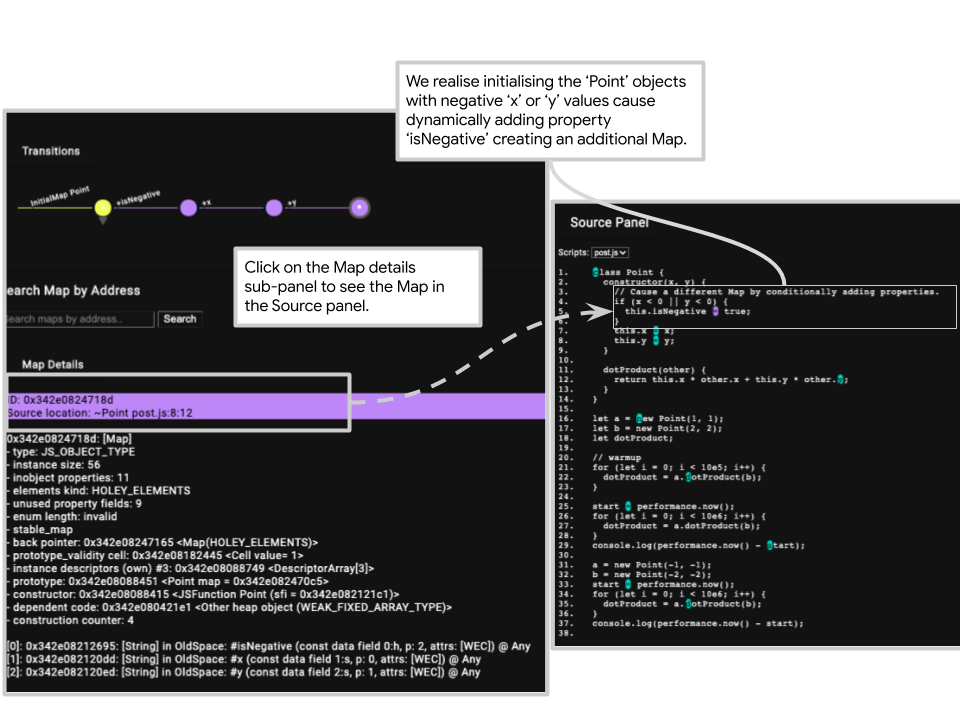 The Map panel communicates the file position information to highlight file positions on the Source panel.
We click on the file position section of the Map panel to see where this isNegative property is added in the source code and can use this insight to address the performance regression.
So now the question being how can we address the performance regression by using the insight we generated from the tool?
The minimal solution would be to always initialise the isNegative property. In general, it is sound advice that all instance properties should be initialised in the constructor.
Now, the updated Point class looks like this:
class Point {
  constructor(x, y) {
    this.isNegative = x < 0 || y < 0;
    this.x = x;
    this.y = y;
  }

  dotProduct(other) {
    return this.x * other.x + this.y * other.y;
  }
}
If we execute the script again with the modified Point class, we see that the execution of the two snippets defined at the beginning of the case study perform very similarly.
In an updated trace, we see that the polymorphic IC state is avoided as we are not creating multiple maps for the same type of objects.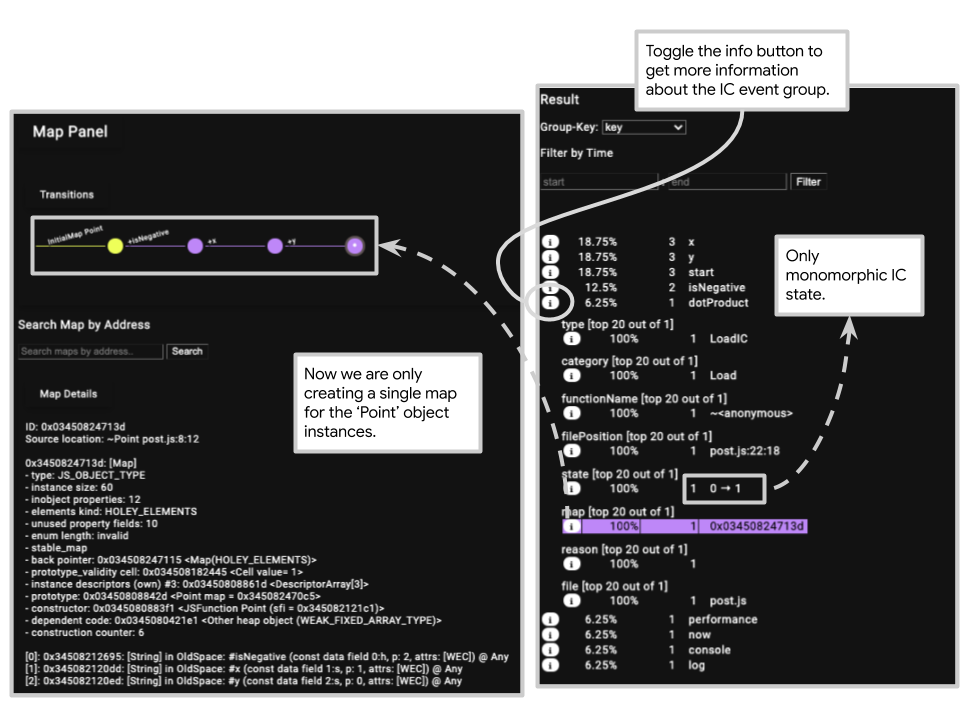 The map transition tree of the modified Point object.
The System Analyzer #
Let's now have an in-depth look at the different panels that are present in the system analyzer.
Timeline Panel #
The Timeline panel allows selection in time which enables visualization of IC/map states across discrete points in time or a selected range in time. It supports filtering features such as zoom in/out to the log events for selected time ranges.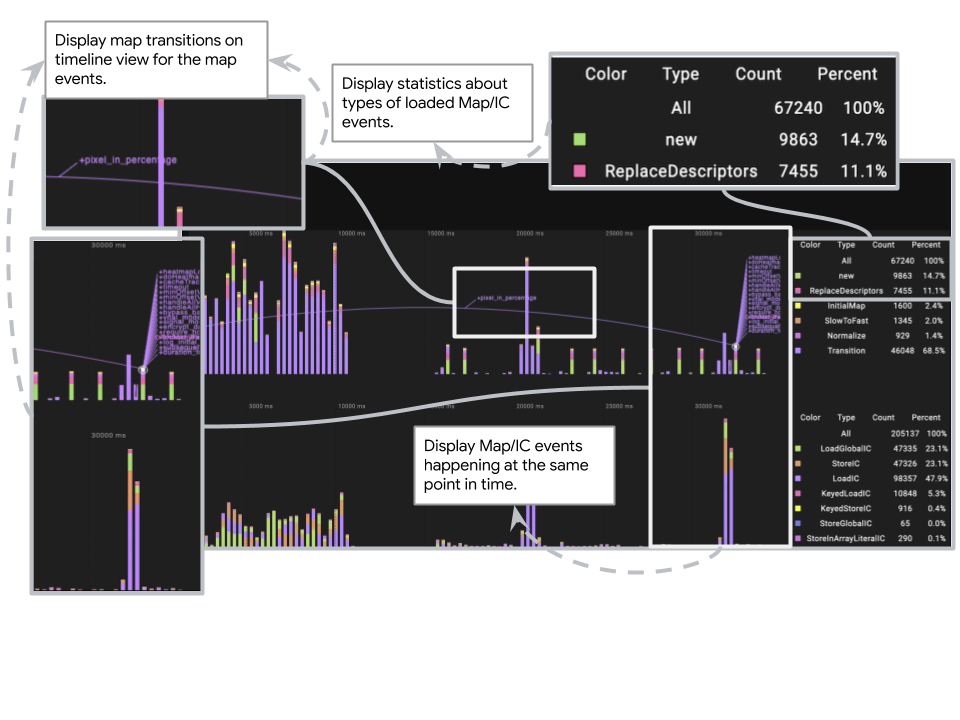 Timeline panel overview
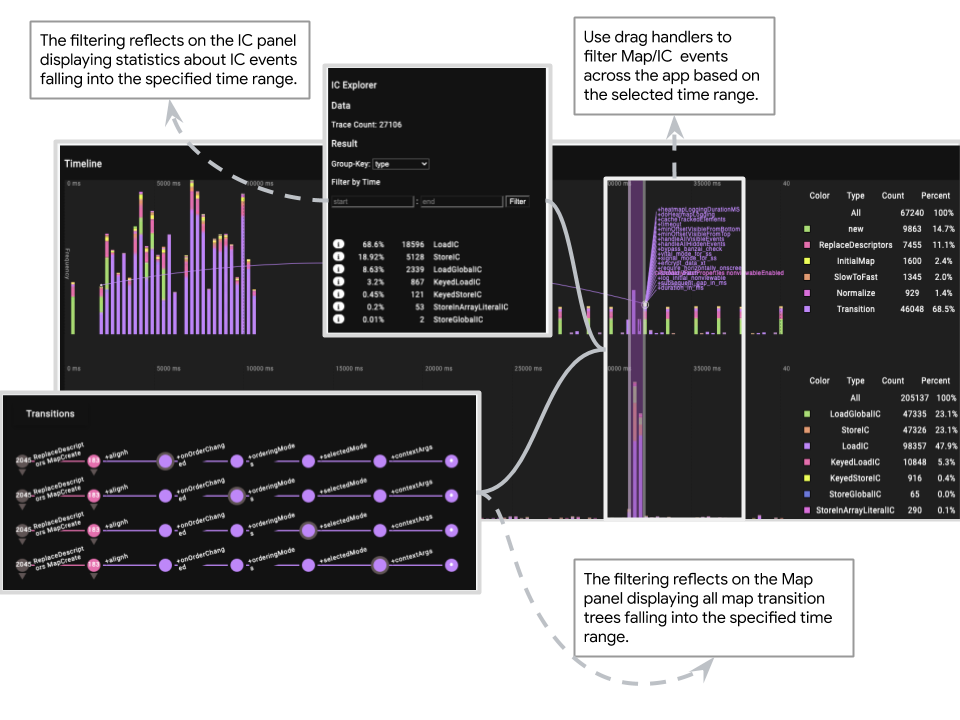 Timeline panel overview (Cont.)
Map Panel #
The Map panel has two sub panels:
- Map details
- Map transitions
The Map panel visualizes the transition trees of selected maps. The metadata of the selected map displayed through the map details sub-panel. A specific transition tree associated with a map address can be searched for using the provided interface. From the Stats sub-panel, which is above the Map transitions sub-panel, we can see the statistics about the properties causing map transitions and types of map events.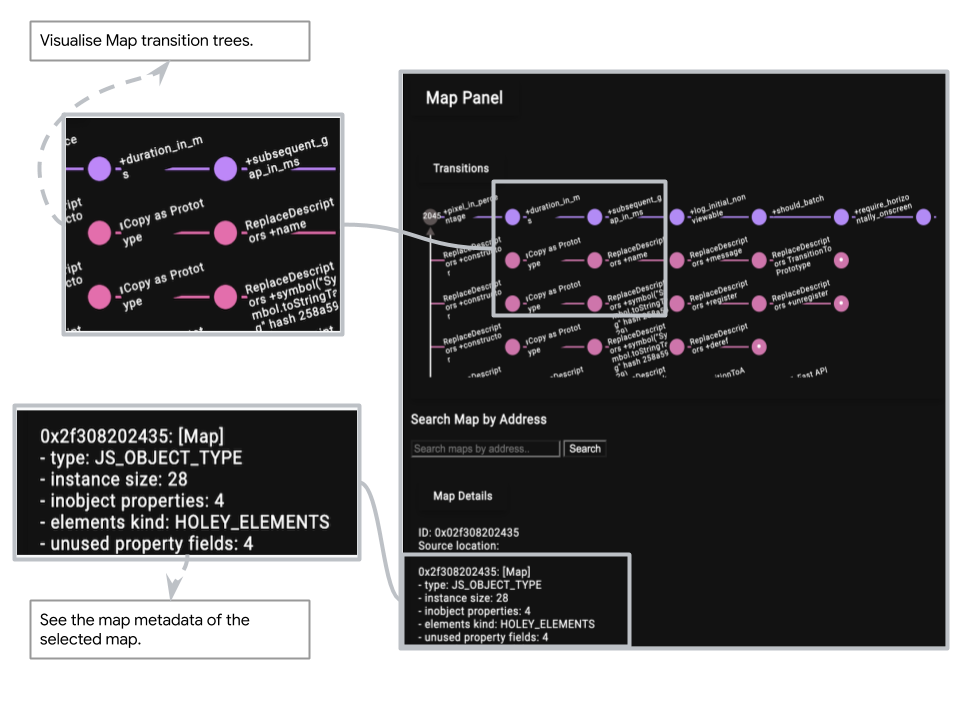 Map panel overview
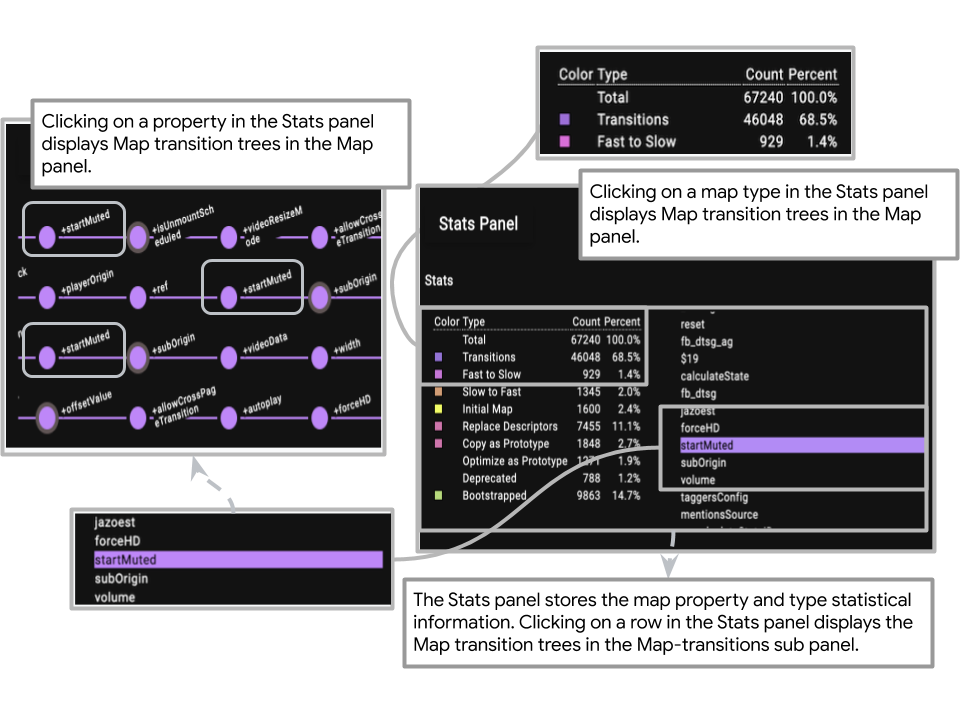 Stats panel overview
IC Panel #
The IC panel displays statistics about IC events falling within a specific time range which are filtered through the Timeline panel. Additionally, the IC panel allows grouping IC events based on various options (type, category, map, file position.). From the grouping options, map and file position grouping option interacts with map and source code panels respectively to display the transition trees of maps and highlight the file positions associated with the IC events.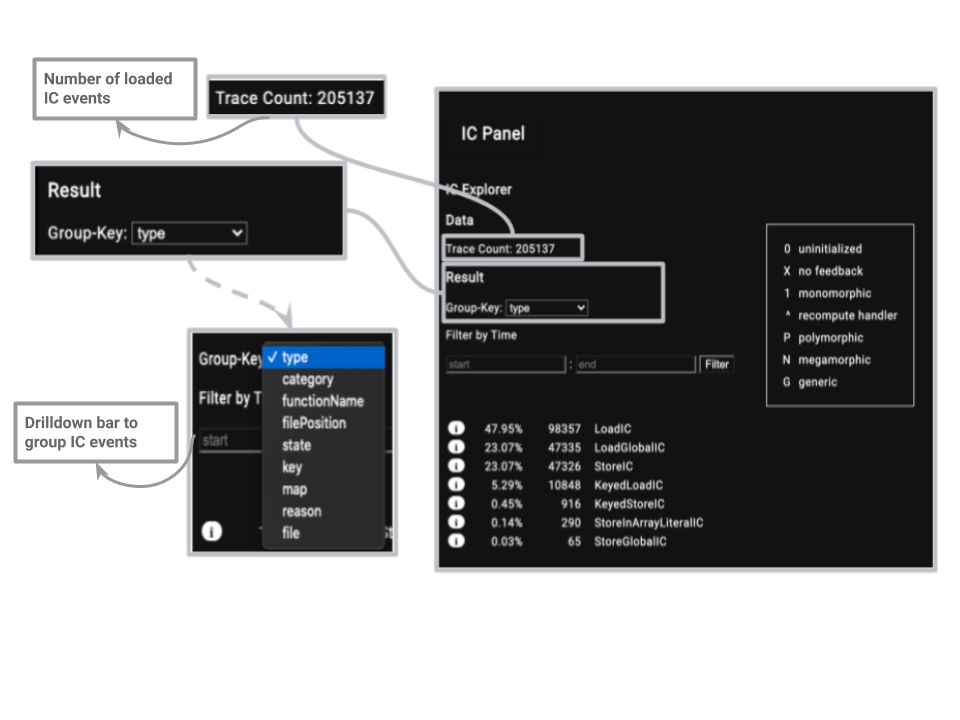 IC panel Overview
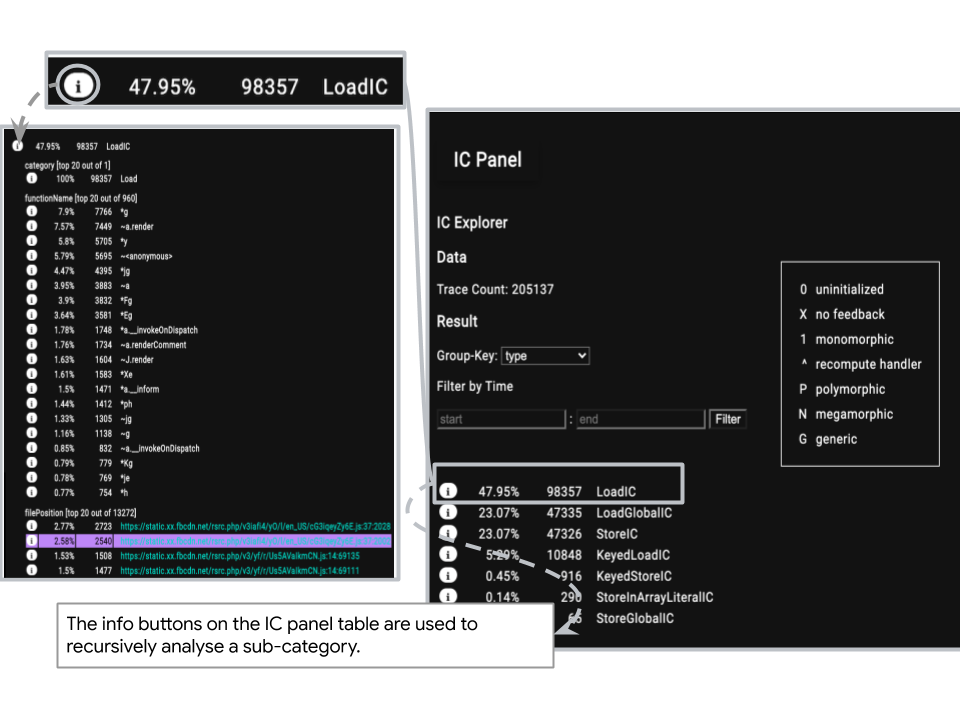 IC panel overview (Cont.)
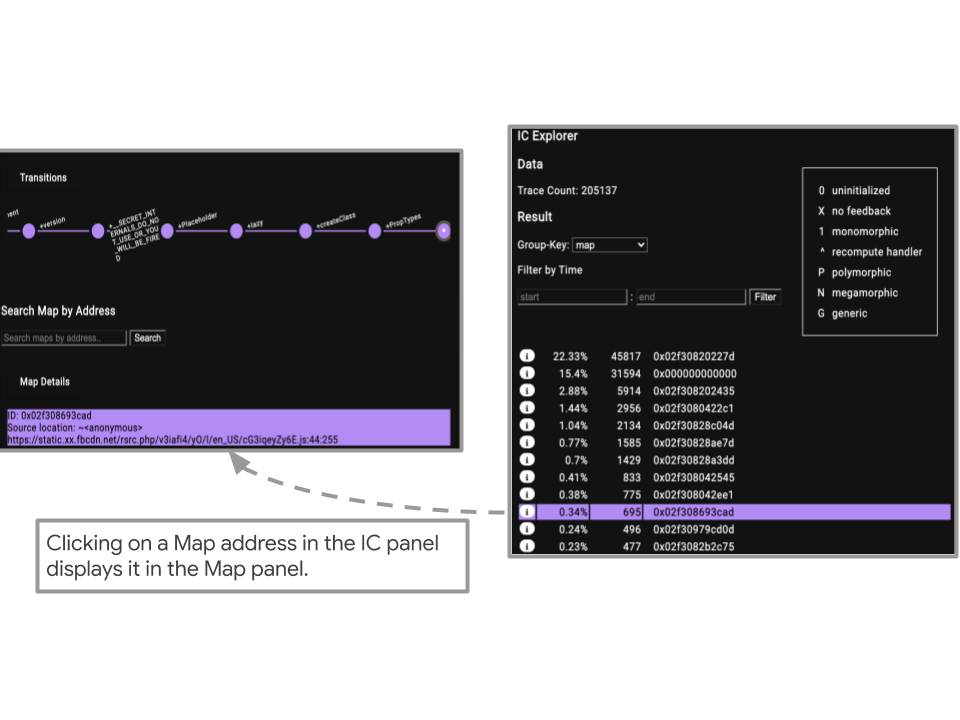 IC panel Overview (Cont.)
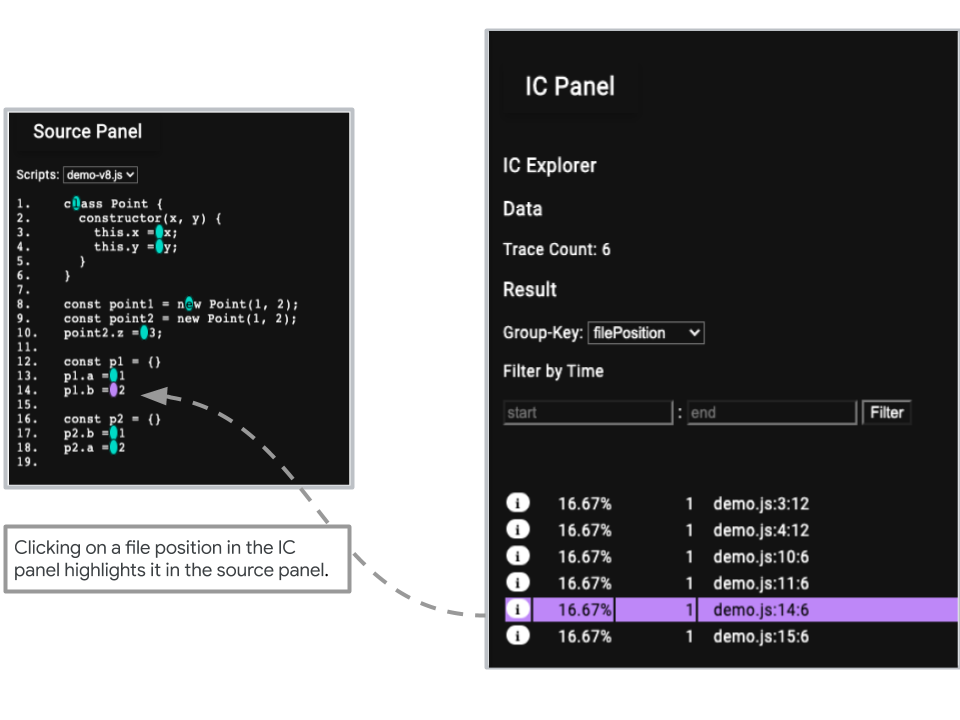 IC panel overview (Cont.)
Source Panel #
The Source panel displays the loaded scripts with clickable markers to emit custom events which selects both Map and IC log events across the custom panels. Selection of a loaded script can be done from the drill down bar. Selecting a file position from Map panel and IC panel highlights the selected file position on the source code panel.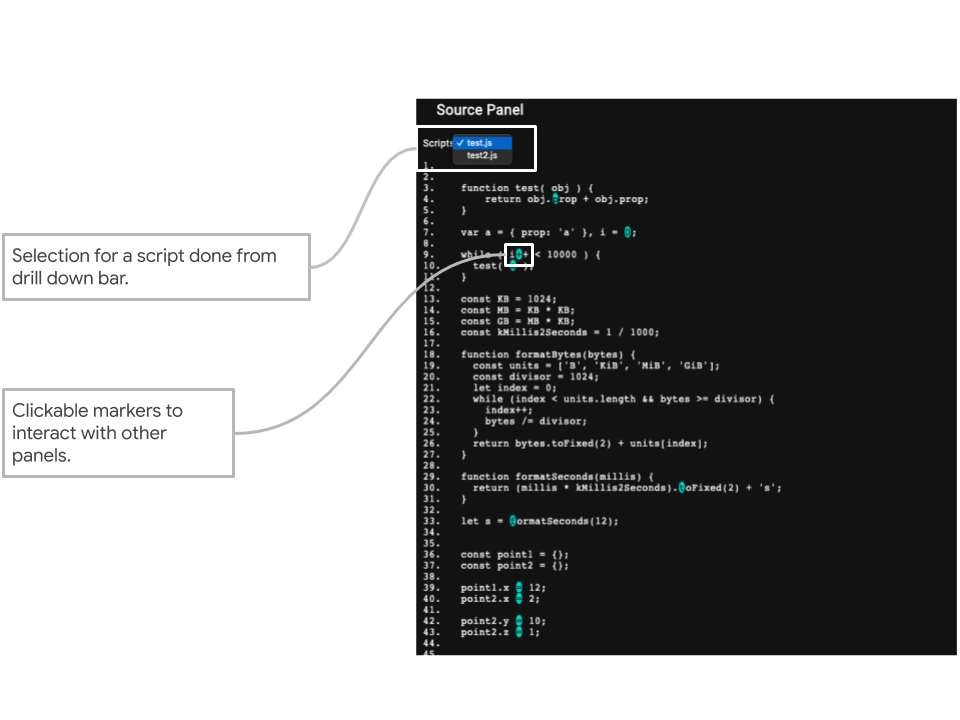 Source panel Overview
Acknowledgements #
I would like to thank everyone in the V8 and Web on Android teams, especially to my host Sathya and co-host Camillo for supporting me throughout my internship and giving me the opportunity to work on such a cool project.
I had an amazing summer interning at Google!