This blog post has been authored by José Dapena Paz (Igalia), with contributions from Jason Williams (Bloomberg), Ashley Claymore (Bloomberg), Rob Palmer (Bloomberg), Joyee Cheung (Igalia), and Shu-yu Guo (Google).
In this post about V8 heap snapshots, I will talk about some performance problems found by Bloomberg engineers, and how we fixed them to make JavaScript memory analysis faster than ever.
The problem #
Bloomberg engineers were working on diagnosing a memory leak in a JavaScript application. It was failing with Out-Of-Memory errors. For the tested application, the V8 heap limit was configured to be around 1400 MB. Normally V8’s garbage collector should be able to keep the heap usage under that limit, so the failures indicated that there was likely a leak.
A common technique to debug a routine memory leak scenario like this is to capture a heap snapshot first, then load it in the DevTools “Memory” tab and find out what is consuming the most memory by inspecting the various summaries and object attributes. In the DevTools UI, the heap snapshot can be taken in the “Memory” tab. For Node.js applications, the heap snapshot can be triggered programmatically using this API:
require('v8').writeHeapSnapshot();
They wanted to capture several snapshots at different points in the application’s life, so that DevTools Memory viewer could be used to show the difference between the heaps at different times. The problem was that capturing a single full-size (500 MB) snapshot was taking over 30 minutes!
It was this slowness in the memory analysis workflow that we needed to solve.
Narrowing the problem #
Then, Bloomberg engineers started investigating the issue using some V8 parameters. As described in the this post, Node.js and V8 have some nice command line parameters that can help with that. These options were used to create the heap snapshots, simplify the reproduction, and improve observability:
--max-old-space-size=100: This limits the heap to 100 megabytes and helps to reproduce the issue much faster.--heapsnapshot-near-heap-limit=10: This is a Node.js specific command line parameter that tells Node.js to generate a snapshot each time it comes close to running out of memory. It is configured to generate up to 10 snapshots in total. This prevents thrashing where the memory-starved program spends a long time producing more snapshots than needed.--enable-etw-stack-walking: This allows tools such as ETW, WPA & xperf to see the JS stack which has been called in V8. (available in Node.js v20+)--interpreted-frames-native-stack: This flag is used in combination with tools like ETW, WPA & xperf to see the native stack when profiling. (available in Node.js v20+).
When the size of the V8 heap is approaching the limit, V8 forces a garbage collection to reduce the memory usage. It also notifies the embedder about this. The --heapsnapshot-near-heap-limit flag in Node.js generates a new heap snapshot upon notification. In the test case, the memory usage decreases, but, after several iterations, garbage collection ultimately can not free up enough space and so the application is terminated with an Out-Of-Memory error.
They took recordings using Windows Performance Analyzer (see below) in order to narrow down the issue. This revealed that most CPU time was being spent within the V8 Heap Explorer. Specifically, it took around 30 minutes just to walk through the heap to visit each node and collect the name. This didn’t seem to make much sense — why would recording the name of each property take so long?
This is when I was asked to take a look.
Quantifying the problem #
The first step was adding support in V8 to better understand where time is spent during the capturing of heap snapshots. The capture process itself is split into two phases: generation, then serialization. We landed this patch upstream to introduce a new command line flag --profile_heap_snapshot to V8, which enables logging of both the generation and serialization times.
Using this flag, we learned some interesting things!
First, we could observe the exact amount of time V8 was spending on generating each snapshot. In our reduced test case, the first took 5 minutes, the second took 8 minutes, and each subsequent snapshot kept on taking longer and longer. Nearly all of this time was spent in the generation phase.
This also allowed us to quantify the time spent on snapshot generation with a trivial overhead, which helped us isolate and identify similar slowdowns in other widely-used JavaScript applications - in particular, ESLint on TypeScript. So we know the problem was not app-specific.
Furthermore, we found the problem happened on both Windows and Linux. The problem was also not platform-specific.
First optimization: improved StringsStorage hashing #
To identify what was causing the excesive delay I profiled the failing script using Windows Performance Toolkit.
When I opened the recording with Windows Performance Analyzer, this was what I found: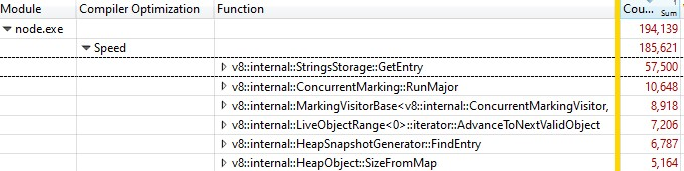
One third of the samples was spent in v8::internal::StringsStorage::GetEntry:
181 base::HashMap::Entry* StringsStorage::GetEntry(const char* str, int len) {
182   uint32_t hash = ComputeStringHash(str, len);
183   return names_.LookupOrInsert(const_cast<char*>(str), hash);
184 }
Because this was run with a release build, the information of the inlined function calls were folded into StringsStorage::GetEntry(). To figure out exactly how much time the inlined function calls were taking, I added the “Source Line Number” column to the breakdown and found that most of the time was spent on line 182, which was a call to ComputeStringHash():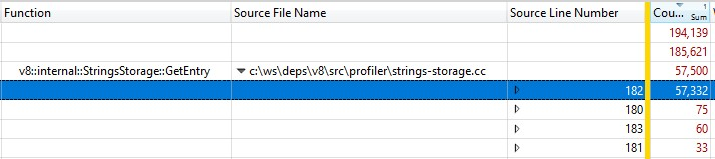
So over 30% of the snapshot generation time was spent on ComputeStringHash(), but why?
Let’s first talk about StringsStorage. Its purpose is to store a unique copy of all the strings that will be used in the heap snapshot. For fast access and avoiding duplicates, this class uses a hashmap backed by an array, where collisions are handled by storing elements in the next free location in the array.
I started to suspect that the problem could be caused by collisions, which could lead to long searches in the array. So I added exhaustive logs to see the generated hash keys and, on insertion, see how far it was between the expected position calculated from the hash key and the actual position the entry ended up in due to collisions.
In the logs, things were… not right: the offset of many items was over 20, and in the worst case, in the order of thousands!
Part of the problem was caused by numeric strings — especially strings for a wide range of consecutive numbers. The hash key algorithm had two implementations, one for numeric strings and another for other strings. While the string hash function was quite classical, the implementation for the numeric strings would basically return the value of the number prefixed by the number of digits:
int32_t OriginalHash(const std::string& numeric_string) {
int kValueBits = 24;
int32_t mask = (1 << kValueBits) - 1;
return (numeric_string.length() << kValueBits) | (numeric_string & mask);
}
x | OriginalHash(x) |
|---|
| 0 | 0x1000000 |
| 1 | 0x1000001 |
| 2 | 0x1000002 |
| 3 | 0x1000003 |
| 10 | 0x200000a |
| 11 | 0x200000b |
| 100 | 0x3000064 |
This function was problematic. Some examples of problems with this hash function:
- Once we inserted a string whose hash key value was a small number, we would run into collisions when we tried to store another number in that location, and there would be similar collisions if we tried to store subsequent numbers consecutively.
- Or even worse: if there were already a lot of consecutive numbers stored in the map, and we wanted to insert a string whose hash key value was in that range, we had to move the entry along all the occupied locations to find a free location.
What did I do to fix it? As the problem comes mostly from numbers represented as strings that would fall in consecutive positions, I modified the hash function so we would rotate the resulting hash value 2 bits to the left.
int32_t NewHash(const std::string& numeric_string) {
  return OriginalHash(numeric_string) << 2;
}
x | OriginalHash(x) | NewHash(x) |
|---|
| 0 | 0x1000000 | 0x4000000 |
| 1 | 0x1000001 | 0x4000004 |
| 2 | 0x1000002 | 0x4000008 |
| 3 | 0x1000003 | 0x400000c |
| 10 | 0x200000a | 0x8000028 |
| 11 | 0x200000b | 0x800002c |
| 100 | 0x3000064 | 0xc000190 |
So for each pair of consecutive numbers, we would introduce 3 free positions in between. This modification was chosen because empirical testing across several work-sets showed that it worked best for minimizing collisions.
This hashing fix has landed in V8.
Second optimization: caching source positions #
After fixing the hashing, we re-profiled and found a further optimization opportunity that would reduce a significant part of the overhead.
When generating a heap snapshot, for each function in the heap, V8 tries to record its start position in a pair of line and column numbers. This information can be used by the DevTools to display a link to the source code of the function. During usual compilation, however, V8 only stores the start position of each function in the form of a linear offset from the beginning of the script. To calculate the line and column numbers based on the linear offset, V8 needs to traverse the whole script and record where the line breaks are. This calculation turns out to be very expensive.
Normally, after V8 finishes calculating the offsets of line breaks in a script, it caches them in a newly allocated array attached to the script. Unfortunately, the snapshot implementation cannot modify the heap when traversing it, so the newly calculated line information cannot be cached.
The solution? Before generating the heap snapshot, we now iterate over all the scripts in the V8 context to compute and cache the offsets of the line breaks. As this is not done when we traverse the heap for heap snapshot generation, it is still possible to modify the heap and store the source line positions as a cache.
The fix for the caching of line break offsets has also landed in V8.
Did we make it fast? #
After enabling both fixes, we re-profiled. Both of our fixes only affect snapshot generation time, so, as expected, snapshot serialization times were unaffected.
When operating on a JS program containing…
- Development JS, generation time is 50% faster 👍
- Production JS, generation time is 90% faster 😮
Why was there a massive difference between production and development code? The production code is optimized using bundling and minification, so there are fewer JS files, and these files tend to be large. It takes longer to calculate source lines positions for these large files, so they benefit the most when we can cache the source position and avoid repeating calculations.
The optimizations were validated on both Windows and Linux target environments.
For the particularly challenging problem originally faced by the Bloomberg engineers, the total end-to-end time to capture a 100MB snapshot was reduced from a painful 10 minutes down to a very pleasant 6 seconds. That is a 100× win! 🔥
The optimizations are generic wins that we expect to be widely applicable to anyone performing memory debugging on V8, Node.js, and Chromium. These wins were shipped in V8 v11.5.130, which means they are found in Chromium 115.0.5576.0. We look forward to Node.js gaining these optimizations in the next semver-major release.
What’s next? #
First, it would be useful for Node.js to accept the new --profile-heap-snapshot flag in NODE_OPTIONS. In some use cases, users cannot control the the command line options passed to Node.js directly and have to configure them through the environment variable NODE_OPTIONS. Today, Node.js filters V8 command line options set in the environment variable, and only allows a known subset, which could make it harder to test new V8 flags in Node.js, as what happened in our case.
Information accuracy in snapshots can be improved further. Today, each script source code line information is stored in a representation in the V8 heap itself. And that’s a problem because we want to measure the heap precisely without the performance measurement overhead affecting the subject we are observing. Ideally, we would store the cache of line information outside the V8 heap in order to make heap snapshot information more accurate.
Finally, now that we improved the generation phase, the biggest cost is now the serialization phase. Further analysis may reveal new optimization opportunities in serialization.
Credits #
This was possible thanks to the work of Igalia and Bloomberg engineers.