Over the last year the V8 team has developed a new methodology to measure and understand real-world JavaScript performance. We’ve used the insights that we gleaned from it to change how the V8 team makes JavaScript faster. Our new real-world focus represents a significant shift from our traditional performance focus. We’re confident that as we continue to apply this methodology in 2017, it will significantly improve users’ and developers’ ability to rely on predictable performance from V8 for real-world JavaScript in both Chrome and Node.js.
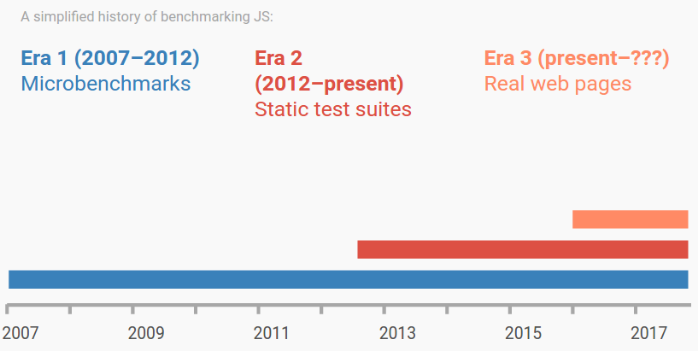
The old adage “what gets measured gets improved” is particularly true in the world of JavaScript virtual machine (VM) development. Choosing the right metrics to guide performance optimization is one of the most important things a VM team can do over time. The following timeline roughly illustrates how JavaScript benchmarking has evolved since the initial release of V8: Evolution of JavaScript benchmarks
Historically, V8 and other JavaScript engines have measured performance using synthetic benchmarks. Initially, VM developers used microbenchmarks like SunSpider and Kraken. As the browser market matured a second benchmarking era began, during which they used larger but nevertheless synthetic test suites such as Octane and JetStream.
Microbenchmarks and static test suites have a few benefits: they’re easy to bootstrap, simple to understand, and able to run in any browser, making comparative analysis easy. But this convenience comes with a number of downsides. Because they include a limited number of test cases, it is difficult to design benchmarks which accurately reflect the characteristics of the web at large. Moreover, benchmarks are usually updated infrequently; thus, they tend to have a hard time keeping up with new trends and patterns of JavaScript development in the wild. Finally, over the years VM authors explored every nook and cranny of the traditional benchmarks, and in the process they discovered and took advantage of opportunities to improve benchmark scores by shuffling around or even skipping externally unobservable work during benchmark execution. This kind of benchmark-score-driven improvement and over-optimizing for benchmarks doesn’t always provide much user- or developer-facing benefit, and history has shown that over the long-term it’s very difficult to make an “ungameable” synthetic benchmark.
Given an intuition that we were only seeing one part of the performance story with traditional static benchmarks, the V8 team set out to measure real-world performance by benchmarking the loading of actual websites. We wanted to measure use cases that reflected how end users actually browsed the web, so we decided to derive performance metrics from websites like Twitter, Facebook, and Google Maps. Using a piece of Chrome infrastructure called WebPageReplay we were able to record and replay page loads deterministically.
In tandem, we developed a tool called Runtime Call Stats which allowed us to profile how different JavaScript code stressed different V8 components. For the first time, we had the ability not only to test V8 changes easily against real websites, but to fully understand how and why V8 performed differently under different workloads.
We now monitor changes against a test suite of approximately 25 websites in order to guide V8 optimization. In addition to the aforementioned websites and others from the Alexa Top 100, we selected sites which were implemented using common frameworks (React, Polymer, Angular, Ember, and more), sites from a variety of different geographic locales, and sites or libraries whose development teams have collaborated with us, such as Wikipedia, Reddit, Twitter, and Webpack. We believe these 25 sites are representative of the web at large and that performance improvements to these sites will be directly reflected in similar speedups for sites being written today by JavaScript developers.
For an in-depth presentation about the development of our test suite of websites and Runtime Call Stats, see the BlinkOn 6 presentation on real-world performance. You can even run the Runtime Call Stats tool yourself.
Making a real difference #
Analyzing these new, real-world performance metrics and comparing them to traditional benchmarks with Runtime Call Stats has also given us more insight into how various workloads stress V8 in different ways.
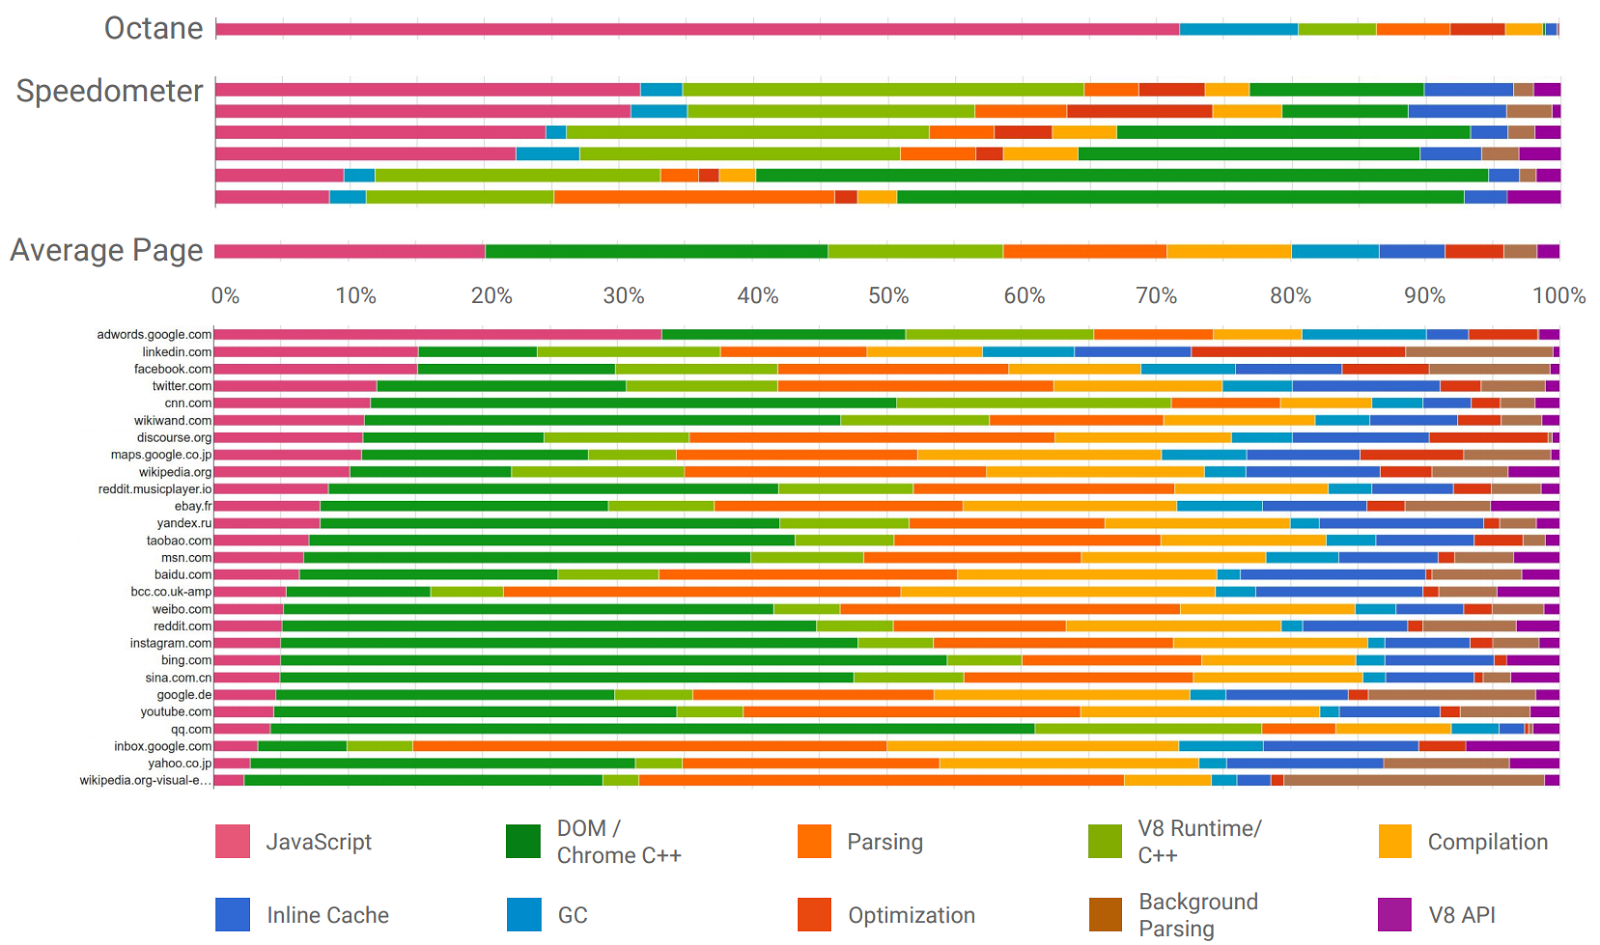
From these measurements, we discovered that Octane performance was actually a poor proxy for performance on the majority of our 25 tested websites. You can see in the chart below: Octane’s color bar distribution is very different than any other workload, especially those for the real-world websites. When running Octane, V8’s bottleneck is often the execution of JavaScript code. However, most real-world websites instead stress V8’s parser and compiler. We realized that optimizations made for Octane often lacked impact on real-world web pages, and in some cases these optimizations made real-world websites slower. Distribution of time running all of Octane, running the line-items of Speedometer, and loading websites from our test suite on Chrome 57
We also discovered that another benchmark was actually a better proxy for real websites. Speedometer, a WebKit benchmark that includes applications written in React, Angular, Ember, and other frameworks, demonstrated a very similar runtime profile to the 25 sites. Although no benchmark matches the fidelity of real web pages, we believe Speedometer does a better job of approximating the real-world workloads of modern JavaScript on the web than Octane.
Bottom line: a faster V8 for all #
Over the course of the past year, the real-world website test suite and our Runtime Call Stats tool has allowed us to deliver V8 performance optimizations that speed up page loads across the board by an average of 10-20%. Given the historical focus on optimizing page load across Chrome, a double-digit improvement to the metric in 2016 is a significant achievement. The same optimizations also improved our score on Speedometer by 20-30%.
These performance improvements should be reflected in other sites written by web developers using modern frameworks and similar patterns of JavaScript. Our improvements to builtins such as Object.create and Function.prototype.bind, optimizations around the object factory pattern, work on V8’s inline caches, and ongoing parser improvements are intended to be generally applicable improvements to underlooked areas of JavaScript used by all developers, not just the representative sites we track.
We plan to expand our usage of real websites to guide V8 performance work. Stay tuned for more insights about benchmarks and script performance.