Memory consumption is an important dimension in the JavaScript virtual machine performance trade-off space. Over the last few months the V8 team analyzed and significantly reduced the memory footprint of several websites that were identified as representative of modern web development patterns. In this blog post we present the workloads and tools we used in our analysis, outline memory optimizations in the garbage collector, and show how we reduced memory consumed by V8’s parser and its compilers.
Benchmarks #
In order to profile V8 and discover optimizations that have impact for the largest number of users, it is crucial to define workloads that are reproducible, meaningful, and simulate common real-world JavaScript usage scenarios. A great tool for this task is Telemetry, a performance testing framework that runs scripted website interactions in Chrome and records all server responses in order to enable predictable replay of these interactions in our test environment. We selected a set of popular news, social, and media websites and defined the following common user interactions for them:
A workload for browsing news and social websites:
- Open a popular news or social website, e.g. Hacker News.
- Click on the first link.
- Wait until the new website is loaded.
- Scroll down a few pages.
- Click the back button.
- Click on the next link on the original website and repeat steps 3-6 a few times.
A workload for browsing media website:
- Open an item on a popular media website, e.g. a video on YouTube.
- Consume that item by waiting for a few seconds.
- Click on the next item and repeat steps 2–3 a few times.
Once a workflow is captured, it can be replayed as often as needed against a development version of Chrome, for example each time there is new version of V8. During playback, V8’s memory usage is sampled at fixed time intervals to obtain a meaningful average. The benchmarks can be found here.
Memory visualization #
One of the main challenges when optimizing for performance in general is to get a clear picture of internal VM state to track progress or weigh potential tradeoffs. For optimizing memory consumption, this means keeping accurate track of V8’s memory consumption during execution. There are two categories of memory that must be tracked: memory allocated to V8’s managed heap and memory allocated on the C++ heap. The V8 Heap Statistics feature is a mechanism used by developers working on V8 internals to get deep insight into both. When the --trace-gc-object-stats flag is specified when running Chrome (54 or newer) or the d8 command line interface, V8 dumps memory-related statistics to the console. We built a custom tool, the V8 heap visualizer, to visualize this output. The tool shows a timeline-based view for both the managed and C++ heaps. The tool also provides a detailed breakdown of the memory usage of certain internal data types and size-based histograms for each of those types.
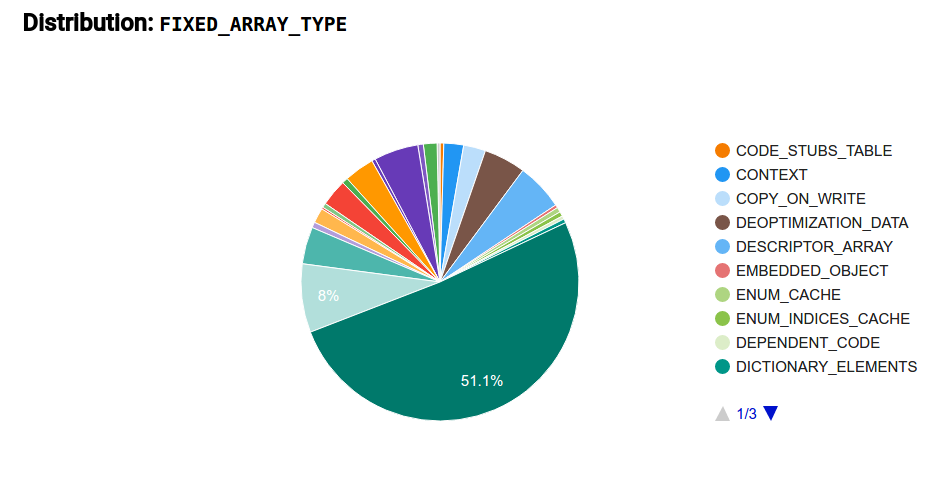
A common workflow during our optimization efforts involves selecting an instance type that takes up a large portion of the heap in the timeline view, as depicted in Figure 1. Once an instance type is selected, the tool then shows a distribution of uses of this type. In this example we selected V8’s internal FixedArray data structure, which is an untyped vector-like container used ubiquitously in all sorts of places in the VM. Figure 2 shows a typical FixedArray distribution, where we can see that the majority of memory can be attributed to a specific FixedArray usage scenario. In this case FixedArrays are used as the backing store for sparse JavaScript arrays (what we call DICTIONARY_ELEMENTS). With this information it is possible to refer back to the actual code and either verify whether this distribution is indeed the expected behavior or whether an optimization opportunity exists. We used the tool to identify inefficiencies with a number of internal types. Figure 1: Timeline view of managed heap and off-heap memory
 Figure 2: Distribution of instance type
Figure 3 shows C++ heap memory consumption, which consists primarily of zone memory (temporary memory regions used by V8 used for a short period of time; discussed in more detail below). Since zone memory is used most extensively by the V8 parser and compilers, the spikes correspond to parsing and compilation events. A well-behaved execution consists only of spikes, indicating that memory is freed as soon as it is no longer needed. In contrast, plateaus (i.e. longer periods of time with higher memory consumption) indicate that there is room for optimization. Figure 3: Zone memory
Early adopters can also try out the integration into Chrome’s tracing infrastructure. Therefore you need to run the latest Chrome Canary with --track-gc-object-stats and capture a trace including the category v8.gc_stats. The data will then show up under the V8.GC_Object_Stats event.
JavaScript heap size reduction #
There is an inherent trade-off between garbage collection throughput, latency, and memory consumption. For example, garbage collection latency (which causes user-visible jank) can be reduced by using more memory to avoid frequent garbage collection invocations. For low-memory mobile devices, i.e. devices with under 512 MB of RAM, prioritizing latency and throughput over memory consumption may result in out-of-memory crashes and suspended tabs on Android.
To better balance the right tradeoffs for these low-memory mobile devices, we introduced a special memory reduction mode which tunes several garbage collection heuristics to lower memory usage of the JavaScript garbage collected heap.
- At the end of a full garbage collection, V8’s heap growing strategy determines when the next garbage collection will happen based on the amount of live objects with some additional slack. In memory reduction mode, V8 uses less slack resulting in less memory usage due to more frequent garbage collections.
- Moreover this estimate is treated as a hard limit, forcing unfinished incremental marking work to finalize in the main garbage collection pause. Normally, when not in memory reduction mode, unfinished incremental marking work may result in going over this limit arbitrarily to trigger the main garbage collection pause only when marking is finished.
- Memory fragmentation is further reduced by performing more aggressive memory compaction.
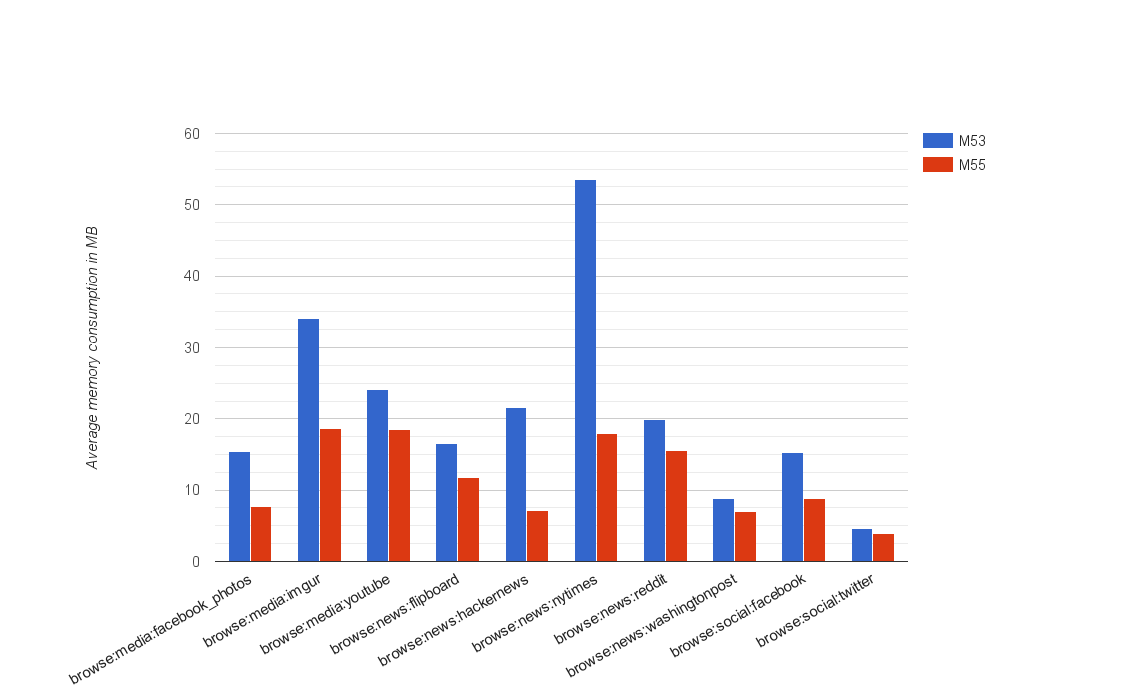
Figure 4 depicts some of the improvements on low memory devices since Chrome 53. Most noticeably, the average V8 heap memory consumption of the mobile New York Times benchmark reduced by about 66%. Overall, we observed a 50% reduction of average V8 heap size on this set of benchmarks. Figure 4: V8 heap memory reduction since Chrome 53 on low-memory devices
Another optimization introduced recently not only reduces memory on low-memory devices but beefier mobile and desktop machines. Reducing the V8 heap page size from 1 MB to 512 kB results in a smaller memory footprint when not many live objects are present and lower overall memory fragmentation up to 2×. It also allows V8 to perform more compaction work since smaller work chunks allow more work to be done in parallel by the memory compaction threads.
Zone memory reduction #
In addition to the JavaScript heap, V8 uses off-heap memory for internal VM operations. The largest chunk of memory is allocated through memory areas called zones. Zones are a type of region-based memory allocator which enables fast allocation and bulk deallocation where all zone allocated memory is freed at once when the zone is destroyed. Zones are used throughout V8’s parser and compilers.
One of the major improvements in Chrome 55 comes from reducing memory consumption during background parsing. Background parsing allows V8 to parse scripts while a page is being loaded. The memory visualization tool helped us discover that the background parser would keep an entire zone alive long after the code was already compiled. By immediately freeing the zone after compilation, we reduced the lifetime of zones significantly which resulted in reduced average and peak memory usage.
Another improvement results from better packing of fields in abstract syntax tree nodes generated by the parser. Previously we relied on the C++ compiler to pack fields together where possible. For example, two booleans just require two bits and should be located within one word or within the unused fraction of the previous word. The C++ compiler doesn’t always find the most compressed packing, so we instead manually pack bits. This not only results in reduced peak memory usage, but also improved parser and compiler performance.
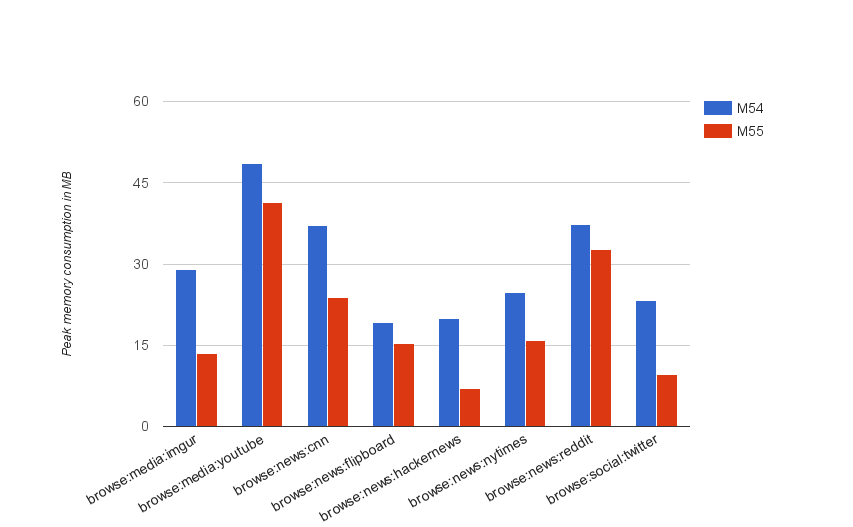
Figure 5 shows the peak zone memory improvements since Chrome 54 which reduced by about 40% on average over the measured websites. Figure 5: V8 peak zone memory reduction since Chrome 54 on desktop
Over the next months we will continue our work on reducing the memory footprint of V8. We have more zone memory optimizations planned for the parser and we plan to focus on devices ranging from 512 MB – 1 GB of memory.
Update: All the improvements discussed above reduce the Chrome 55 overall memory consumption by up to 35% on low-memory devices compared to Chrome 53. Other device segments only benefit from the zone memory improvements.