Code coverage provides information about whether, and optionally how often certain parts of an application have been executed. It’s commonly used to determine how thoroughly a test suite exercises a particular codebase.
Why is it useful? #
As a JavaScript developer, you may often find yourself in a situation in which code coverage could be useful. For instance:
- Interested in the quality of your test suite? Refactoring a large legacy project? Code coverage can show you exactly which parts of your codebase is covered.
- Want to quickly know if a particular part of the codebase is reached? Instead of instrumenting with
console.log for printf-style debugging or manually stepping through the code, code coverage can display live information about which parts of your applications have been executed. - Or maybe you’re optimizing for speed and would like to know which spots to focus on? Execution counts can point out hot functions and loops.
JavaScript code coverage in V8 #
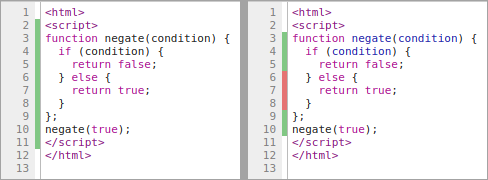
Earlier this year, we added native support for JavaScript code coverage to V8. The initial release in version 5.9 provided coverage at function granularity (showing which functions have been executed), which was later extended to support coverage at block granularity in v6.2 (likewise, but for individual expressions). Function granularity (left) and block granularity (right)
For JavaScript developers #
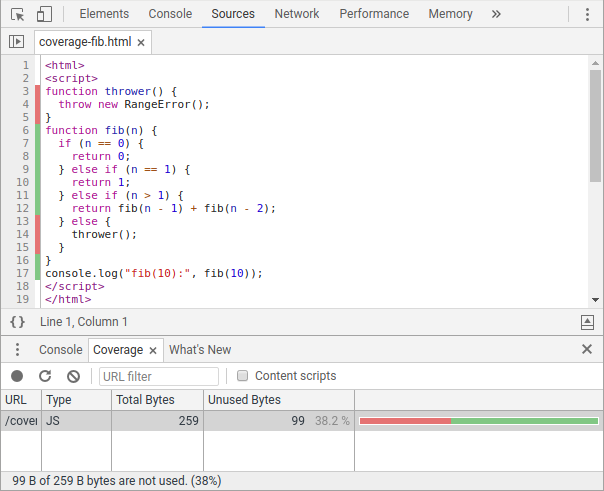
There are currently two primary ways to access coverage information. For JavaScript developers, Chrome DevTools’ Coverage tab exposes JS (and CSS) coverage ratios and highlights dead code in the Sources panel. Block coverage in the DevTools Coverage pane. Covered lines are highlighted in green, uncovered in red.
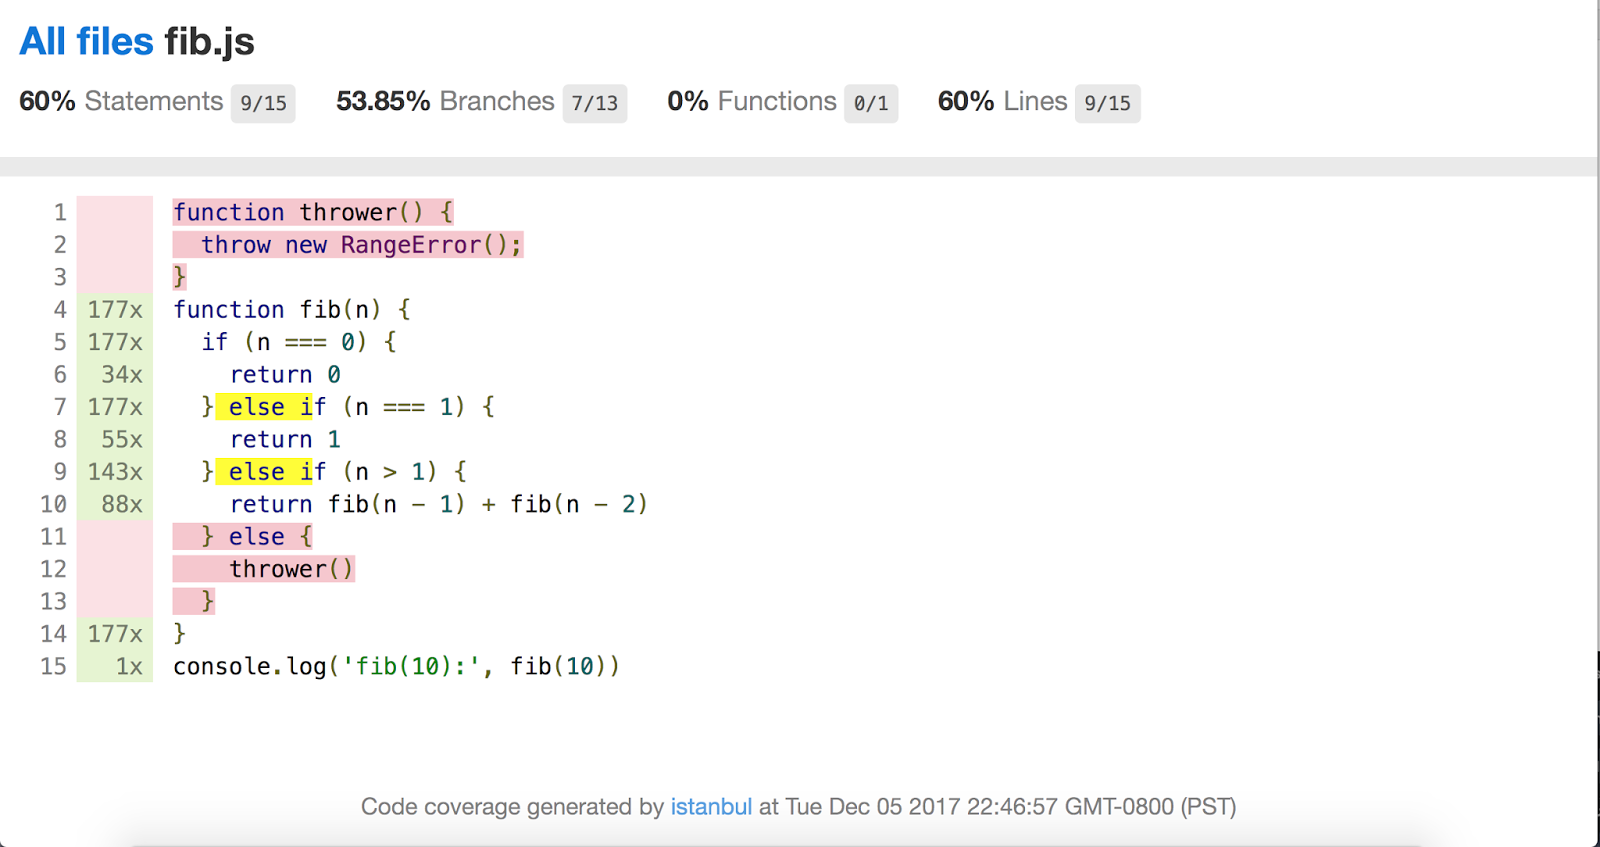
Thanks to Benjamin Coe, there is also ongoing work to integrate V8’s code coverage information into the popular Istanbul.js code coverage tool. An Istanbul.js report based on V8 coverage data.
For embedders #
Embedders and framework authors can hook directly into the Inspector API for more flexibility. V8 offers two different coverage modes:
Best-effort coverage collects coverage information with minimal impact on runtime performance, but might lose data on garbage-collected (GC) functions.
Precise coverage ensures that no data is lost to the GC, and users can choose to receive execution counts instead of binary coverage information; but performance might be impacted by increased overhead (see the next section for more details). Precise coverage can be collected either at function or block granularity.
The Inspector API for precise coverage is as follows:
A conversation through the Inspector protocol might look like this:
{ "id": 26, "method": "Profiler.startPreciseCoverage",
"params": { "callCount": false, "detailed": true }}
{ "id": 32, "method":"Profiler.takePreciseCoverage" }
{ "id": 32, "result": { "result": [{
"functions": [
{
"functionName": "fib",
"isBlockCoverage": true,
"ranges": [
{
"startOffset": 50,
"endOffset": 224,
"count": 1
}, {
"startOffset": 97,
"endOffset": 107,
"count": 0
}, {
"startOffset": 134,
"endOffset": 144,
"count": 0
}, {
"startOffset": 192,
"endOffset": 223,
"count": 0
},
]},
"scriptId": "199",
"url": "file:///coverage-fib.html"
}
]
}}
{"id":37,"method":"Profiler.stopPreciseCoverage"}
Similarly, best-effort coverage can be retrieved using Profiler.getBestEffortCoverage().
Behind the scenes #
As stated in the previous section, V8 supports two main modes of code coverage: best-effort and precise coverage. Read on for an overview of their implementation.
Best-effort coverage #
Both best-effort and precise coverage modes heavily reuse other V8 mechanisms, the first of which is called the invocation counter. Each time a function is called through V8’s Ignition interpreter, we increment an invocation counter on the function’s feedback vector. As the function later becomes hot and tiers up through the optimizing compiler, this counter is used to help guide inlining decisions about which functions to inline; and now, we also rely on it to report code coverage.
The second reused mechanism determines the source range of functions. When reporting code coverage, invocation counts need to be tied to an associated range within the source file. For example, in the example below, we not only need to report that function f has been executed exactly once, but also that f’s source range begins at line 1 and ends in line 3.
function f() {
  console.log('Hello World');
}

f();
Again we got lucky and were able to reuse existing information within V8. Functions already knew their start- and end positions within source code due to Function.prototype.toString, which needs to know the function’s location within the source file to extract the appropriate substring.
When collecting best-effort coverage, these two mechanisms are simply tied together: first we find all live function by traversing the entire heap. For each seen function we report the invocation count (stored on the feedback vector, which we can reach from the function) and source range (conveniently stored on the function itself).
Note that since invocation counts are maintained regardless of whether coverage is enabled, best-effort coverage does not introduce any runtime overhead. It also does not use dedicated data structures and thus neither needs to be explicitly enabled or disabled.
So why is this mode called best-effort, what are its limitations? Functions that go out of scope may be freed by the garbage collector. This means that associated invocation counts are lost, and in fact we completely forget that these functions ever existed. Ergo ‘best-effort’: even though we try our best, the collected coverage information may be incomplete.
Precise coverage (function granularity) #
In contrast to the best-effort mode, precise coverage guarantees that the provided coverage information is complete. To achieve this, we add all feedback vectors to V8’s root set of references once precise coverage is enabled, preventing their collection by the GC. While this ensures no information is lost, it increases memory consumption by keeping objects alive artificially.
The precise coverage mode can also provide execution counts. This adds another wrinkle to the precise coverage implementation. Recall that the invocation counter is incremented each time a function is called through V8’s interpreter, and that functions can tier up and be optimized once they become hot. But optimized functions no longer increment their invocation counter, and thus the optimizing compiler must be disabled for their reported execution count to remain accurate.
Precise coverage (block granularity) #
Block-granularity coverage must report coverage that is correct down to the level of individual expressions. For example, in the following piece of code, block coverage could detect that the else branch of the conditional expression : c is never executed, while function granularity coverage would only know that the function f (in its entirety) is covered.
function f(a) {
  return a ? b : c;
}

f(true);
You may recall from the previous sections that we already had function invocation counts and source ranges readily available within V8. Unfortunately, this was not the case for block coverage and we had to implement new mechanisms to collect both execution counts and their corresponding source ranges.
The first aspect is source ranges: assuming we have an execution count for a particular block, how can we map them to a section of the source code? For this, we need to collect relevant positions while parsing the source files. Prior to block coverage, V8 already did this to some extent. One example is the collection of function ranges due to Function.prototype.toString as described above. Another is that source positions are used to construct the backtrace for Error objects. But neither of these is sufficient to support block coverage; the former is only available for functions, while the latter only stores positions (e.g. the position of the if token for if-else statements), not source ranges.
We therefore had to extend the parser to collect source ranges. To demonstrate, consider an if-else statement:
if (cond) {
} else {
}
When block coverage is enabled, we collect the source range of the then and else branches and associate them with the parsed IfStatement AST node. The same is done for other relevant language constructs.
After collecting source range collection during parsing, the second aspect is tracking execution counts at runtime. This is done by inserting a new dedicated IncBlockCounter bytecode at strategic positions within the generated bytecode array. At runtime, the IncBlockCounter bytecode handler simply increments the appropriate counter (reachable through the function object).
In the above example of an if-else statement, such bytecodes would be inserted at three spots: immediately prior to the body of the then branch, prior to the body of the else branch, and immediately after the if-else statement (such continuation counters are needed due to possibility of non-local control within a branch).
Finally, reporting block-granularity coverage works similarly to function-granularity reporting. But in addition to invocations counts (from the feedback vector), we now also report the collection of interesting source ranges together with their block counts (stored on an auxiliary data structure that hangs off the function).
If you’d like to learn more about the technical details behind code coverage in V8, see the coverage and block coverage design documents.
Conclusion #
We hope you’ve enjoyed this brief introduction to V8’s native code coverage support. Please give it a try and don’t hesitate to let us know what works for you, and what doesn’t. Say hello on Twitter (@schuay and @hashseed) or file a bug at crbug.com/v8/new.
Coverage support in V8 has been a team effort, and thanks are in order to everyone that has contributed: Benjamin Coe, Jakob Gruber, Yang Guo, Marja Hölttä, Andrey Kosyakov, Alexey Kozyatinksiy, Ross McIlroy, Ali Sheikh, Michael Starzinger. Thank you!