Note: If you prefer watching a presentation over reading articles, then enjoy the video below! If not, skip the video and read on.
One large change to the cost of JavaScript over the last few years has been an improvement in how fast browsers can parse and compile script. In 2019, the dominant costs of processing scripts are now download and CPU execution time.
User interaction can be delayed if the browser’s main thread is busy executing JavaScript, so optimizing bottlenecks with script execution time and network can be impactful.
Actionable high-level guidance #
What does this mean for web developers? Parse & compile costs are no longer as slow as we once thought. The three things to focus on for JavaScript bundles are:
- Improve download time
- Keep your JavaScript bundles small, especially for mobile devices. Small bundles improve download speeds, lower memory usage, and reduce CPU costs.
- Avoid having just a single large bundle; if a bundle exceeds ~50–100 kB, split it up into separate smaller bundles. (With HTTP/2 multiplexing, multiple request and response messages can be in flight at the same time, reducing the overhead of additional requests.)
- On mobile you’ll want to ship much less especially because of network speeds, but also to keep plain memory usage low.
- Improve execution time
- Avoid Long Tasks that can keep the main thread busy and can push out how soon pages are interactive. Post-download, script execution time is now a dominant cost.
- Avoid large inline scripts (as they’re still parsed and compiled on the main thread). A good rule of thumb is: if the script is over 1 kB, avoid inlining it (also because 1 kB is when code caching kicks in for external scripts).
Why does download and execution time matter? #
Why is it important to optimize download and execution times? Download times are critical for low-end networks. Despite the growth in 4G (and even 5G) across the world, our effective connection types remain inconsistent with many of us running into speeds that feel like 3G (or worse) when we’re on the go.
JavaScript execution time is important for phones with slow CPUs. Due to differences in CPU, GPU, and thermal throttling, there are huge disparities between the performance of high-end and low-end phones. This matters for the performance of JavaScript, as execution is CPU-bound.
In fact, of the total time a page spends loading in a browser like Chrome, anywhere up to 30% of that time can be spent in JavaScript execution. Below is a page load from a site with a pretty typical workload (Reddit.com) on a high-end desktop machine: JavaScript processing represents 10–30% of time spent in V8 during page load.
On mobile, it takes 3–4× longer for a median phone (Moto G4) to execute Reddit’s JavaScript compared to a high-end device (Pixel 3), and over 6× as long on a low-end device (the <$100 Alcatel 1X): The cost of Reddit’s JavaScript across a few different device classes (low-end, average, and high-end)
Note: Reddit has different experiences for desktop and mobile web, and so the MacBook Pro results cannot be compared to the other results.
When you’re trying to optimize JavaScript execution time, keep an eye out for Long Tasks that might be monopolizing the UI thread for long periods of time. These can block critical tasks from executing even if the page looks visually ready. Break these up into smaller tasks. By splitting up your code and prioritizing the order in which it is loaded, you can get pages interactive faster and hopefully have lower input latency.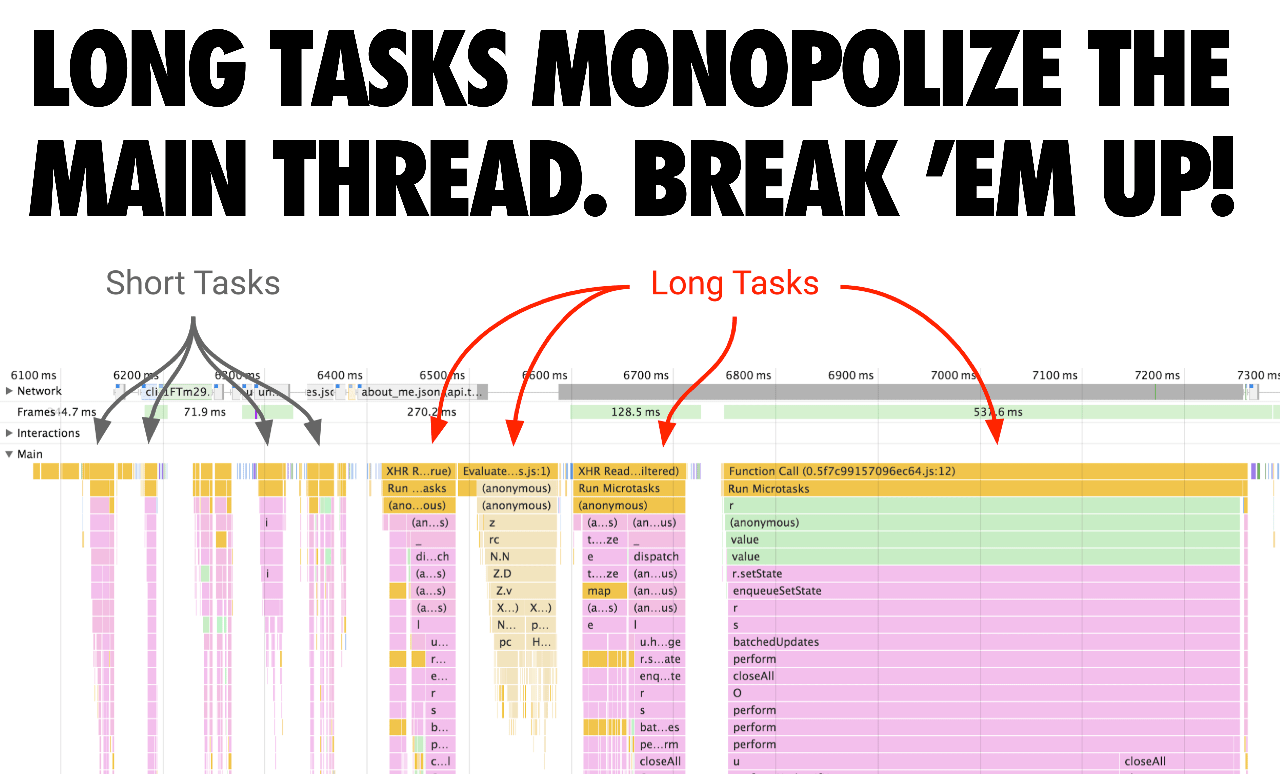 Long tasks monopolize the main thread. You should break them up.
What has V8 done to improve parse/compile? #
Raw JavaScript parsing speed in V8 has increased 2× since Chrome 60. At the same time, raw parse (and compile) cost has become less visible/important due to other optimization work in Chrome that parallelizes it.
V8 has reduced the amount of parsing and compilation work on the main thread by an average of 40% (e.g. 46% on Facebook, 62% on Pinterest) with the highest improvement being 81% (YouTube), by parsing and compiling on a worker thread. This is in addition to the existing off-main-thread streaming parse/compile. V8 parse times across different versions
We can also visualize the CPU time impact of these changes across different versions of V8 across Chrome releases. In the same amount of time it took Chrome 61 to parse Facebook’s JS, Chrome 75 can now parse both Facebook’s JS AND 6 times Twitter’s JS. In the time it took Chrome 61 to parse Facebook’s JS, Chrome 75 can now parse both Facebook’s JS and 6 times Twitter’s JS.
Let’s dive into how these changes were unlocked. In short, script resources can be streaming-parsed and-compiled on a worker thread, meaning:
- V8 can parse+compile JavaScript without blocking the main thread.
- Streaming starts once the full HTML parser encounters a
<script> tag. For parser-blocking scripts, the HTML parser yields, while for async scripts it continues. - For most real-world connection speeds, V8 parses faster than download, so V8 is done parsing+compiling a few milliseconds after the last script bytes are downloaded.
The not-so-short explanation is… Much older versions of Chrome would download a script in full before beginning to parse it, which is a straightforward approach but it doesn’t fully utilize the CPU. Between versions 41 and 68, Chrome started parsing async and deferred scripts on a separate thread as soon as the download begins. Scripts arrive in multiple chunks. V8 starts streaming once it’s seen at least 30 kB.
In Chrome 71, we moved to a task-based setup where the scheduler could parse multiple async/deferred scripts at once. The impact of this change was a ~20% reduction in main thread parse time, yielding an overall ~2% improvement in TTI/FID as measured on real-world websites. Chrome 71 moved to a task-based setup where the scheduler could parse multiple async/deferred scripts at once.
In Chrome 72, we switched to using streaming as the main way to parse: now also regular synchronous scripts are parsed that way (not inline scripts though). We also stopped canceling task-based parsing if the main thread needs it, since that just unnecessarily duplicates any work already done.
Previous versions of Chrome supported streaming parsing and compilation where the script source data coming in from the network had to make its way to Chrome’s main thread before it would be forwarded to the streamer.
This often resulted in the streaming parser waiting for data that arrived from the network already, but had not yet been forwarded to the streaming task as it was blocked by other work on the main thread (like HTML parsing, layout, or JavaScript execution).
We are now experimenting with starting parsing on preload, and the main-thread-bounce was a blocker for this beforehand.
Leszek Swirski’s BlinkOn presentation goes into more detail:“Parsing JavaScript in zero* time” as presented by Leszek Swirski at BlinkOn 10.
In addition to the above, there was an issue in DevTools that rendered the entire parser task in a way that hints that it’s using CPU (full block). However, the parser blocks whenever it’s starved for data (that needs to go over the main thread). Since we moved from a single streamer thread to streaming tasks, this became really obvious. Here’s what you’d use to see in Chrome 69: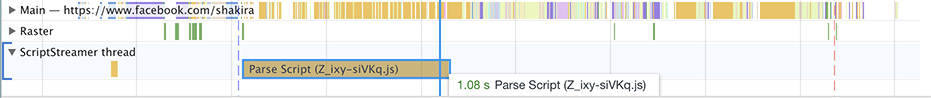 The DevTools issue that rendered the entire parser task in a way that hints that it’s using CPU (full block)
The “parse script” task is shown to take 1.08 seconds. However, parsing JavaScript isn’t really that slow! Most of that time is spent doing nothing except waiting for data to go over the main thread.
Chrome 76 paints a different picture: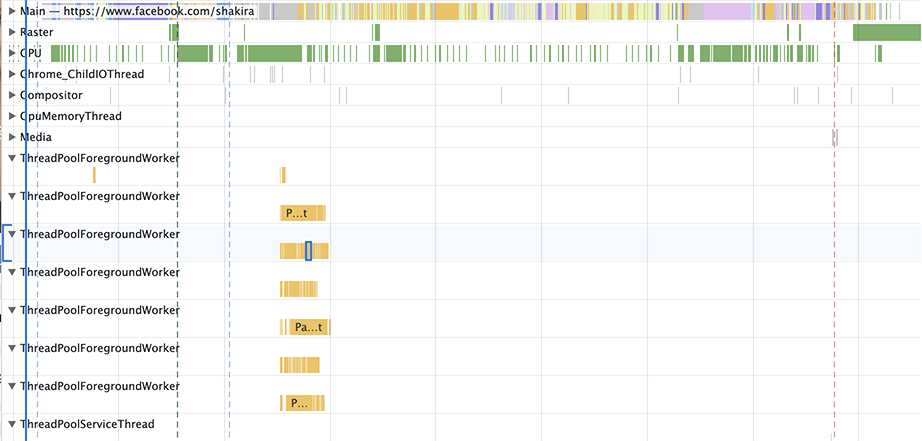 In Chrome 76, parsing is broken up into multiple smaller streaming tasks.
In general, the DevTools performance pane is great for getting a high-level overview of what’s happening on your page. For detailed V8-specific metrics such as JavaScript parse and compile times, we recommend using Chrome Tracing with Runtime Call Stats (RCS). In RCS results, Parse-Background and Compile-Background tell you how much time was spent parsing and compiling JavaScript off the main thread, whereas Parse and Compile captures the main thread metrics.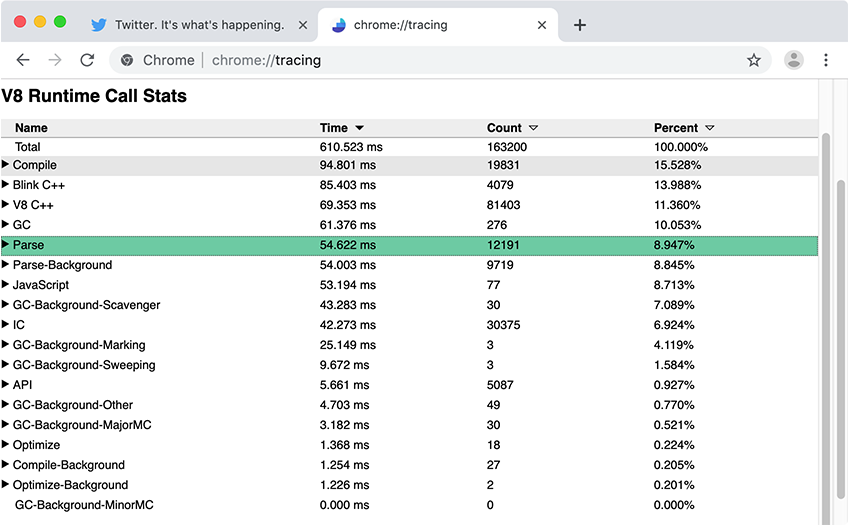
What is the real-world impact of these changes? #
Let’s look at some examples of real-world sites and how script streaming applies. Main thread vs. worker thread time spent parsing and compiling Reddit’s JS on a MacBook Pro
Reddit.com has several 100 kB+ bundles which are wrapped in outer functions causing lots of lazy compilation on the main thread. In the above chart, the main thread time is all that really matters because keeping the main thread busy can delay interactivity. Reddit spends most of its time on the main thread with minimum usage of the Worker/Background thread.
They’d benefit from splitting up some of their larger bundles into smaller ones (e.g 50 kB each) without the wrapping to maximize parallelization — so that each bundle could be streaming-parsed + compiled separately and reduce main thread parse/compile during start-up. Main thread vs. worker thread time spent parsing and compiling Facebook’s JS on a MacBook Pro
We can also look at a site like Facebook.com. Facebook loads ~6MB of compressed JS across ~292 requests, some of it async, some preloaded, and some fetched with a lower priority. A lot of their scripts are very small and granular — this can help with overall parallelization on the Background/Worker thread as these smaller scripts can be streaming-parsed/compiled at the same time.
Note, you’re probably not Facebook and likely don’t have a long-lived app like Facebook or Gmail where this much script may be justifiable on desktop. However, in general, keep your bundles coarse and only load what you need.
Although most JavaScript parsing and compilation work can happen in a streaming fashion on a background thread, some work still has to happen on the main thread. When the main thread is busy, the page can’t respond to user input. Do keep an eye on the impact both downloading and executing code has on your UX.
Note: Currently, not all JavaScript engines and browsers implement script streaming as a loading optimization. We still believe the overall guidance here leads to good user experiences across the board.
The cost of parsing JSON #
Because the JSON grammar is much simpler than JavaScript’s grammar, JSON can be parsed more efficiently than JavaScript. This knowledge can be applied to improve start-up performance for web apps that ship large JSON-like configuration object literals (such as inline Redux stores). Instead of inlining the data as a JavaScript object literal, like so:
const data = { foo: 42, bar: 1337 };
…it can be represented in JSON-stringified form, and then JSON-parsed at runtime:
const data = JSON.parse('{"foo":42,"bar":1337}');
As long as the JSON string is only evaluated once, the JSON.parse approach is much faster compared to the JavaScript object literal, especially for cold loads. A good rule of thumb is to apply this technique for objects of 10 kB or larger — but as always with performance advice, measure the actual impact before making any changes.
JSON.parse('…') is much faster to parse, compile, and execute compared to an equivalent JavaScript literal — not just in V8 (1.7× as fast), but in all major JavaScript engines.
The following video goes into more detail on where the performance difference comes from, starting at the 02:10 mark.“Faster apps with JSON.parse” as presented by Mathias Bynens at #ChromeDevSummit 2019.
See our JSON ⊂ ECMAScript feature explainer for an example implementation that, given an arbitrary object, generates a valid JavaScript program that JSON.parses it.
There’s an additional risk when using plain object literals for large amounts of data: they could be parsed twice!
- The first pass happens when the literal gets preparsed.
- The second pass happens when the literal gets lazy-parsed.
The first pass can’t be avoided. Luckily, the second pass can be avoided by placing the object literal at the top-level, or within a PIFE.
What about parse/compile on repeat visits? #
V8’s (byte)code-caching optimization can help. When a script is first requested, Chrome downloads it and gives it to V8 to compile. It also stores the file in the browser’s on-disk cache. When the JS file is requested a second time, Chrome takes the file from the browser cache and once again gives it to V8 to compile. This time, however, the compiled code is serialized, and is attached to the cached script file as metadata.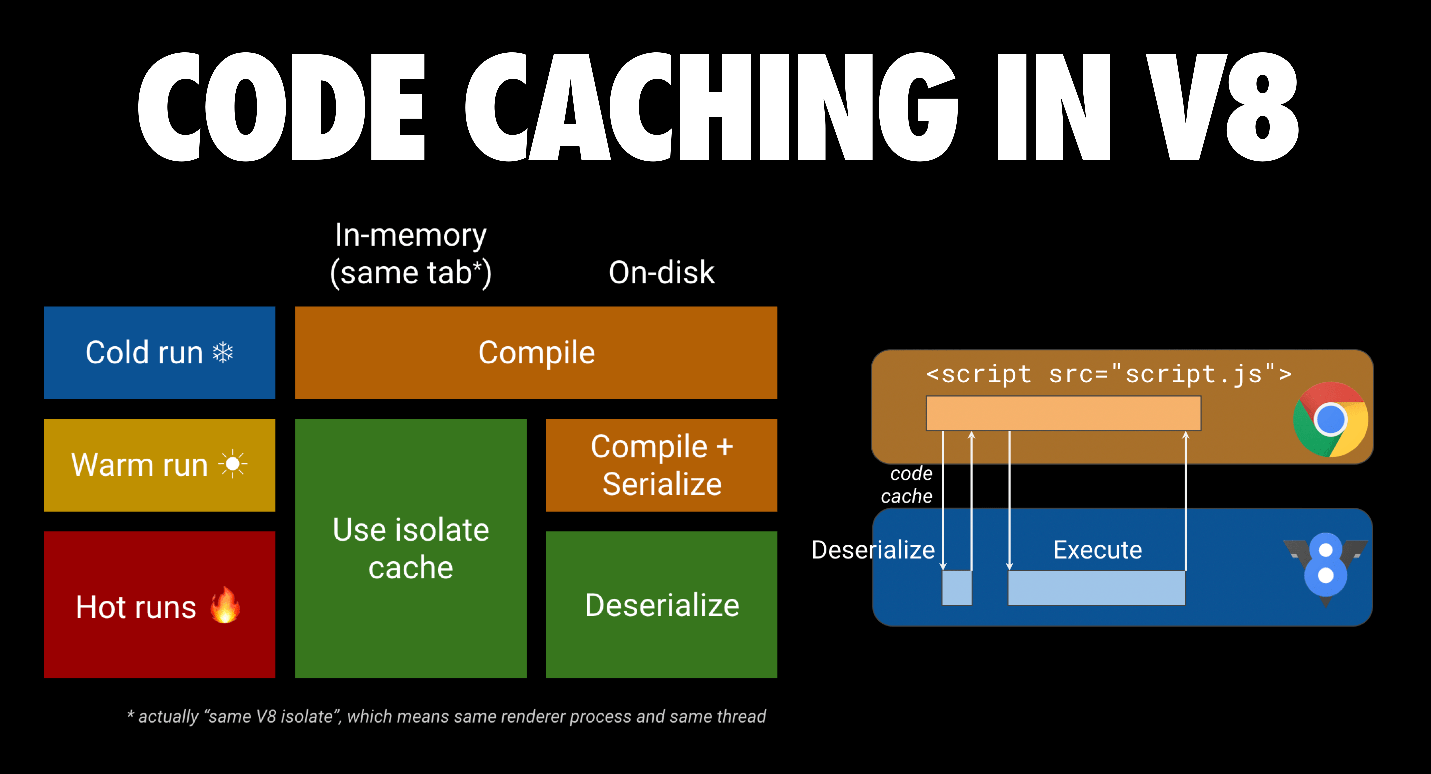 Visualization of how code caching works in V8
The third time, Chrome takes both the file and the file’s metadata from the cache, and hands both to V8. V8 deserializes the metadata and can skip compilation. Code caching kicks in if the first two visits happen within 72 hours. Chrome also has eager code caching if a service worker is used to cache scripts. You can read more about code caching in code caching for web developers.
Conclusions #
Download and execution time are the primary bottlenecks for loading scripts in 2019. Aim for a small bundle of synchronous (inline) scripts for your above-the-fold content with one or more deferred scripts for the rest of the page. Break down your large bundles so you focus on only shipping code the user needs when they need it. This maximizes parallelization in V8.
On mobile, you’ll want to ship a lot less script because of network, memory consumption and execution time for slower CPUs. Balance latency with cacheability to maximize the amount of parsing and compilation work that can happen off the main thread.
Further reading #